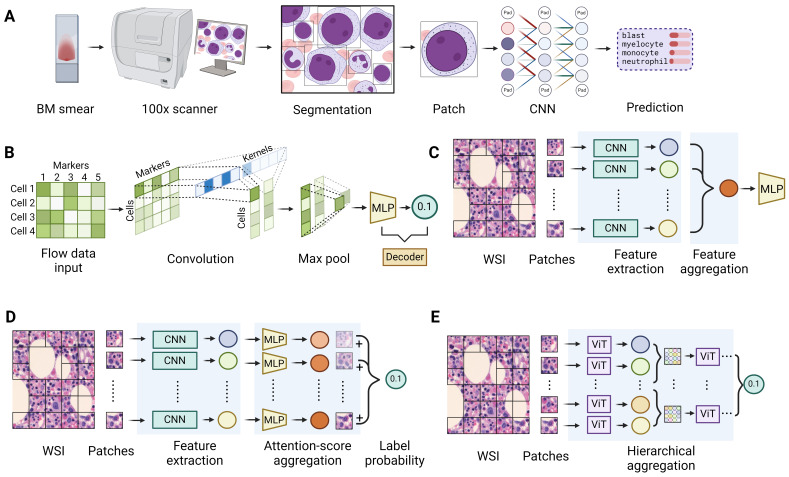
Figure 5. Deep learning models on cytomorphology and whole slide image (WSI).
(A) A workflow of automatic white blood cell (WBC) annotation on bone marrow smear samples. First, the smears are scanned and magnified, and regions with appropriate cell density are identified. Next, object detection algorithms, either based on hand-crafted features or pre-trained deep learning networks like Faster R-CNN or YOLO, are applied to draw bounding boxes around individual WBCs. Finally, a convolutional neural network (CNN) is used to classify the specific cell type within each bounding box. (B) A deep learning model for automatic analysis of flow cytometry data takes the raw data table, where rows represent individual cells and columns represent marker fluorescence intensities, as input to a CNN. The CNN kernels have the same width as the number of markers and a height of one, summarizing marker information for each cell. A max pooling layer then selects the most prominent cells. Finally, an MLP prediction head outputs the probability of the presence of cells with specific marker combinations. (C) The general framework for WSI analysis. First, the high resolution WSIs are divided into smaller patches, after which feature extractors, such as CNNs or ViTs, are applied to each patch to obtain meaningful representations. Next, a feature aggregation step, using techniques like pooling or attention score-based methods, combines the patch-level features into a unified representation. Finally, the aggregated features are passed through a prediction head to generate the desired output, such as class probabilities. (D) WSI analysis using an attention score-based aggregator. After extracting features from individual patches using a CNN, MLPs are used to generate attention scores indicating the significance of each patch for classification. These scores enable the creation of a heat map on the WSI, highlighting the most informative regions. The patch-level features are then weighted by their attention scores and summed to generate the overall probability of a certain label. (E) WSI analysis using a hierarchical aggregator. At the lowest level of hierarchy, a ViT is used to extract features from the pixels of individual patches. The extracted patch-level features are then treated as “pixels” for the next level of the hierarchy, forming higher-level “patches”, where a ViT can be applied again to extract the features. This process can be repeated and at the highest level, a final ViT extracts the slide-level representation.

