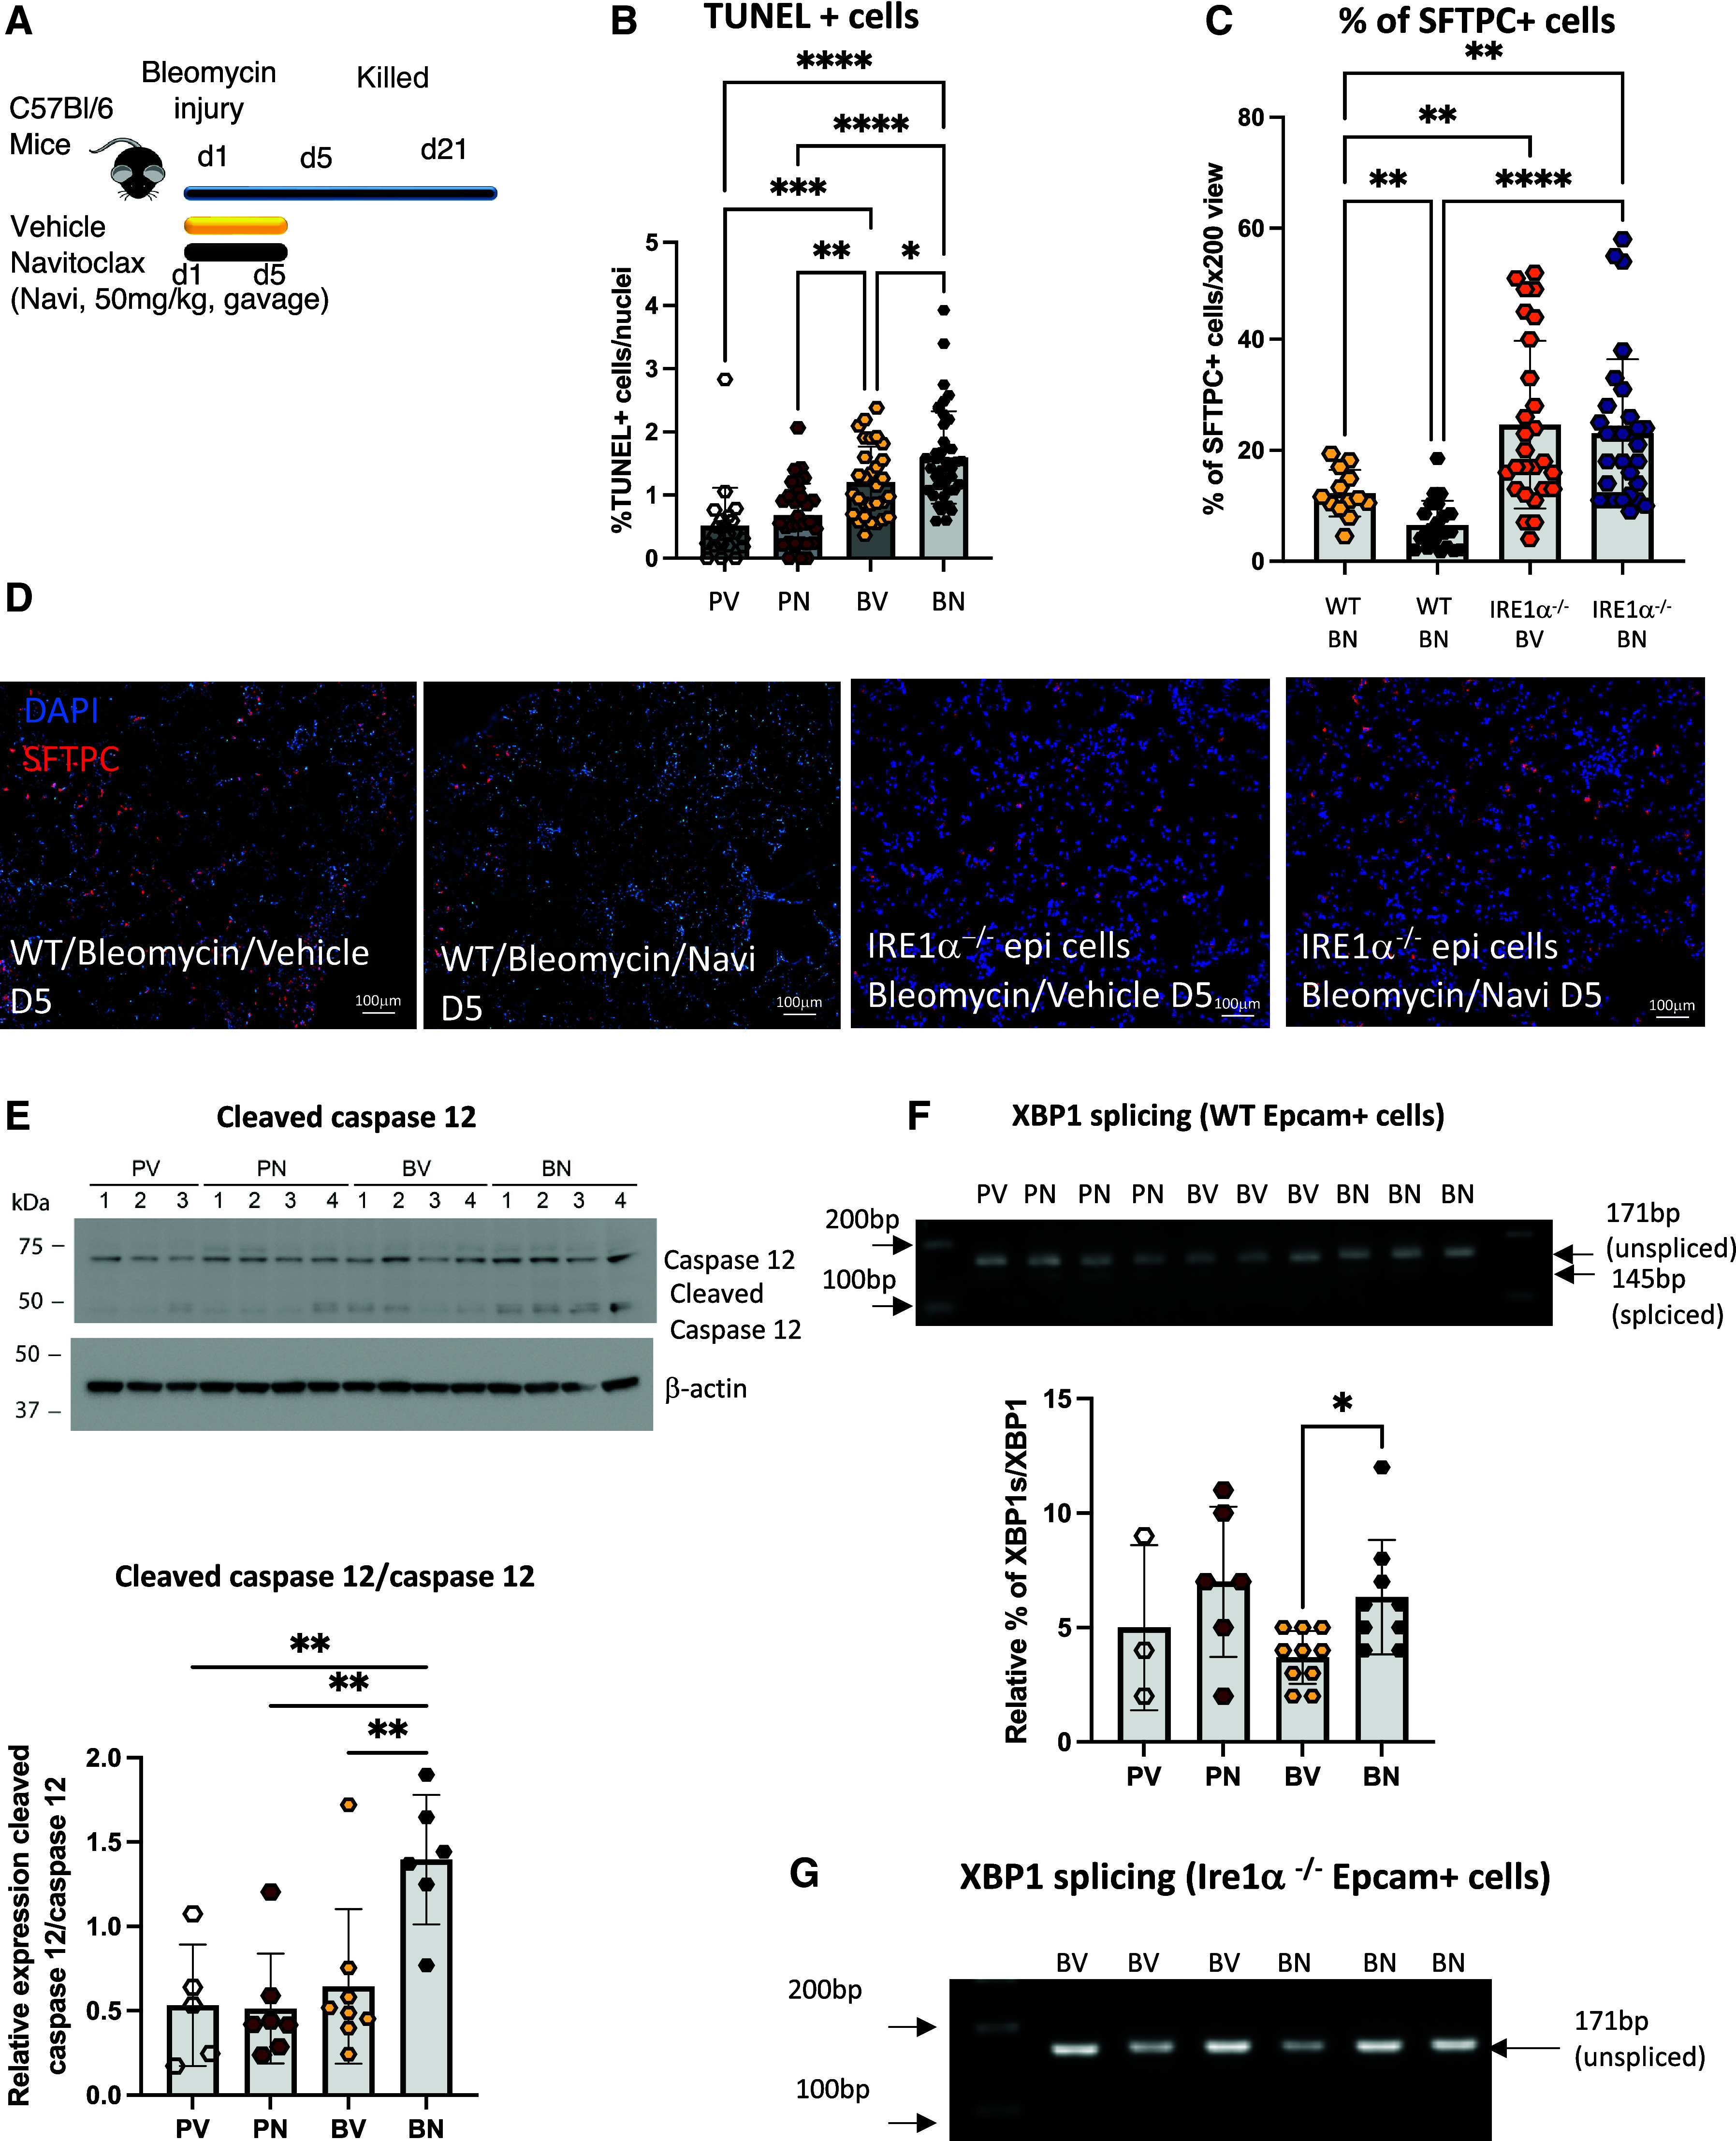
Figure 1.

Inhibition of BCL-2/BCL-xL after bleomycin injury promotes an IRE1α-dependent loss of alveolar type II cells. (A) Schematic of bleomycin injury model and early navitoclax treatment. Navitoclax (Navi; 50 mg/kg) or vehicle was given by gavage for 5 consecutive days to the mice immediately after bleomycin injury. (B) Bar graph of the percentage of TUNEL-positive cells in PBS-treated (P) or bleomycin-injured (B) lungs after vehicle (V) or navitoclax (N) treatment. n = 3 mice per group. Bleomycin-injured (BN) wild-type (WT) C57BL/6J and Ire1α−/−Shhcre lungs after navitoclax treatment; BV = bleomycin-injured WT C57BL/6J and Ire1α−/−Shhcre lungs after vehicle treatment; PN = bleomycin-injured WT C57BL/6J and Ire1α−/−Shhcre lungs after navitoclax treatment; PV = bleomycin-injured WT C57BL/6J and Ire1α−/−Shhcre lungs after vehicle treatment. (C) Bar graph of the percentage of surfactant protein C–positive (SFTPC+) cells in BV and BN samples. n = 3 mice per group. (D) Representative images of SFTPC immunostaining of bleomycin-injured lungs treated with vehicle or navitoclax. Lungs were collected 5 days after bleomycin injury. Scale bars, 100 μm. (E) Western blot of caspase-12 and cleaved caspase-12 using whole WT mouse lungs collected 5 days after bleomycin injury and treatment with navitoclax. Bar graph representation of the relative level of expression of the ratio of cleaved caspase-12 to caspase-12. Each data point represents an individual mouse. (F) Representative ethidium bromide–stained agarose gel of XBP1 cDNA amplicons after vehicle or navitoclax treatment of PBS-treated or bleomycin-injured WT Epcam+ cells. Bar graph representation of the ratio of spliced amplicons to spliced plus unspliced amplicons. Each data point represents an individual mouse. (G) Representative ethidium bromide–stained agarose gel of XBP1 cDNA amplicons after navitoclax treatment of bleomycin-injured Ire1α−/−Shhcre Epcam+ cells. Data represent mean ± SD. *P < 0.05, **P < 0.01, ***P < 0.001, and ****P < 0.0001 as determined by one-way ANOVA followed by Tukey multiple comparison test (B and E) or Dunnett’s multiple comparison (C and F). D = day; epi = epithelial; TUNEL = terminal deoxynucleotidyl transferase dUTP nick end labeling.
