Figure 1.
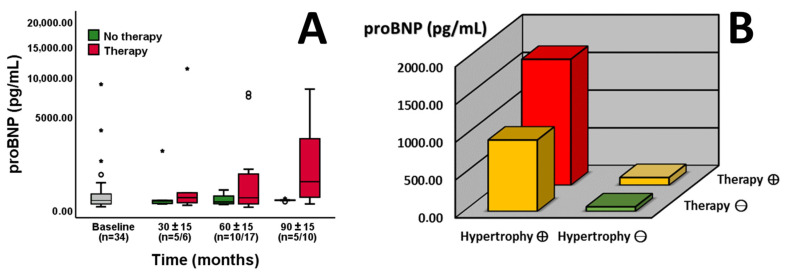
Longitudinal development of NT-proBNP values in patients with (red boxplots) or without (green boxplots) specific therapy ((A), n = indicated). There is a trend towards differences after 60 months (p = 0.083) and significant differences after 90 months (p = 0.020). NT-proBNP values of all available time points are stratified by therapy and the presence of left ventricular hypertrophy ((B), n = 87, the red bar indicates both factors, the yellow bar one, and the green bar none). Patients on specific therapy with left ventricular hypertrophy (red bar) display increased NT-proBNP levels in contrast to those without these two factors (green bar, p = 0.026). The Y-axis is shown as a percentage function (A) to highlight low NT-proBNP values. A p-value of <0.05 was considered statistically significant. “*” indicates outliers within the cohort.

