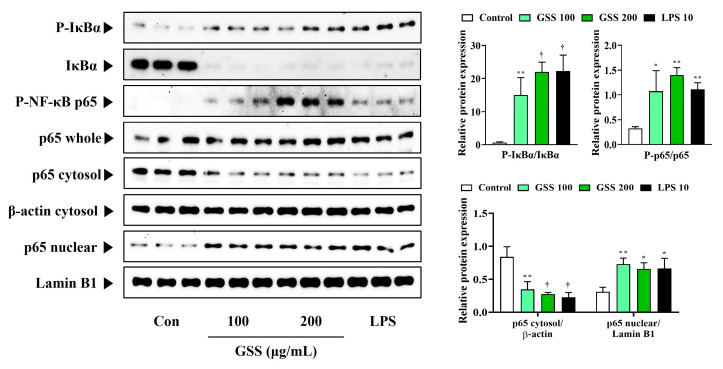
Figure 6.
Effects of GSS on the activation of NF-κB in RAW 264.7 macrophages. Cells were incubated with GSS or LPS for 1 h. Histogram graphs show the production levels of protein relative to total-form protein, β-actin, or Lamin B1. Data were acquired from three independently obtained protein samples. A p value less than 0.05 (vs. control) was considered statistically significant.

