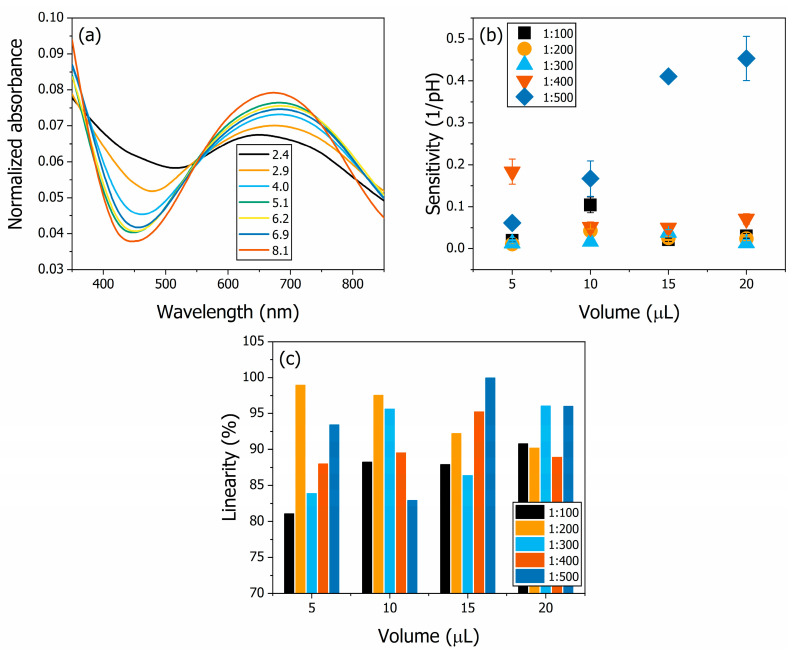
Figure 3.
The optical pH sensor for drop-casted PANI thin films. The normalized absorbance spectra for different pH buffer electrolytes for sample PANI20500 are shown in (a). The sensitivities of the samples are shown in (b). The sensitivities were calculated from the calibration curve of integrated normalized absorbance, and the highest value obtained was 0.45 ± 0.05 1/pH in PANI20500. The linearities of the samples are shown in (c). The lowest linearity obtained was 81% in PANI05100.

