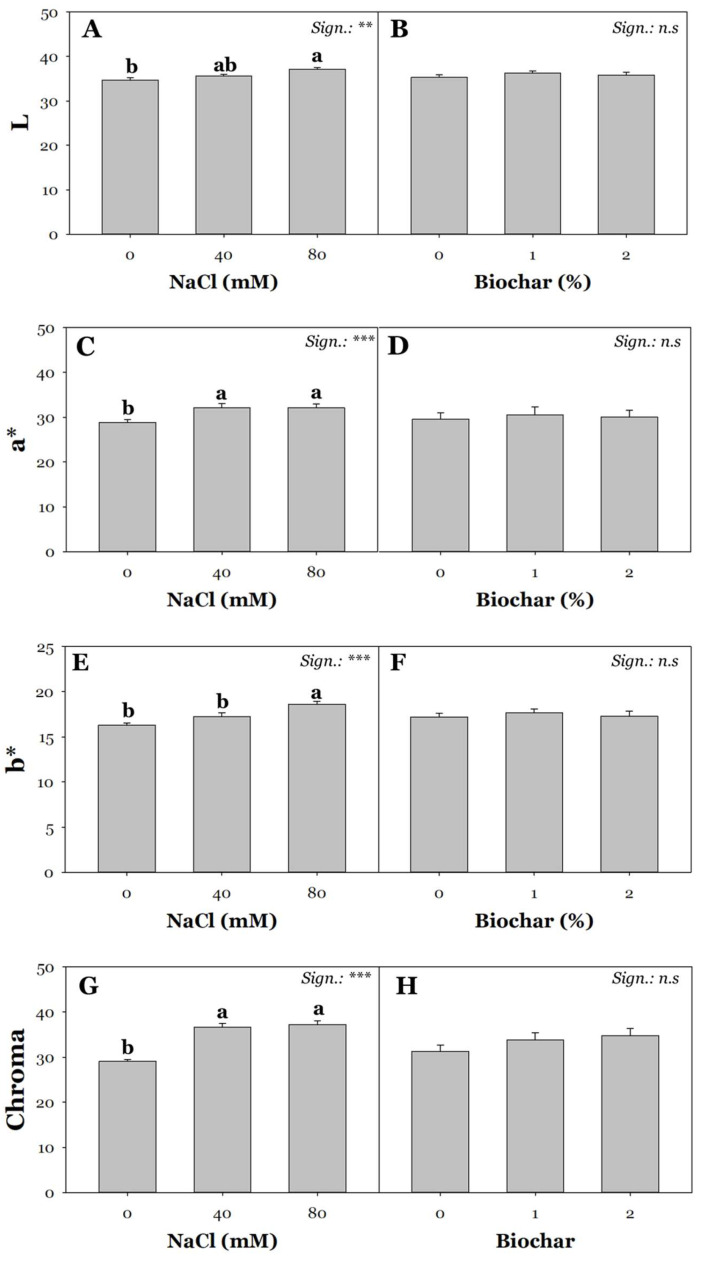
Figure 3.
Effect of saline irrigation with three NaCl levels (0, 40, 80 mM) and effect of biochar treatment at three different concentrations (0, 1, and 2%) on CIELab color space parameters: L (A,B), a* (C,D), b* (E,F), and chroma (G,H). Mean comparisons were performed by Tukey’s HSD post-hoc test. Different letters within each column indicate significant differences between means (p ≤ 0.05). ** and *** denote significant effects at p ≤ 0.01 and p ≤ 0.001, respectively (n = 3).

