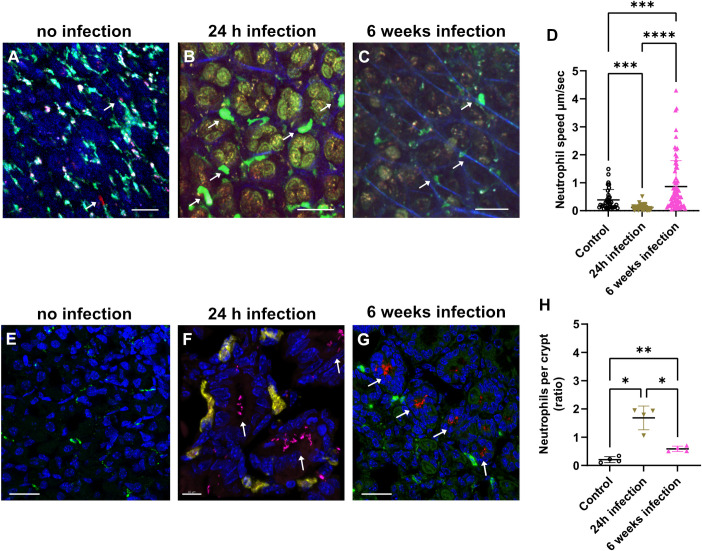
Fig 3. Neutrophil recruitment after H. pylori infection monitored by multiphoton microscopy in vivo.
Mice were infected with H. pylori for 24 hours or 6 weeks. (A) Multiphoton 4D time-lapse images of uninfected CX3CR1-GFP+ mice, which were injected with anti-Ly6G-PE antibodies to visualize neutrophils in red. (B) LysM-eGFP mice show neutrophil recruitment (green) after H. pylori 24h weeks of infection (red), second harmonic generation (SHG) showing the vessels walls (blue) or 6 weeks after infection in (C). (D) Histogram showing neutrophil velocity at 24 hours and 6 weeks post-infection. Neutrophils show significantly reduced mobility in the gastric mucosa in vivo after the first 24 hours of H. pylori infection compared to control. After 6 weeks of H. pylori infection, neutrophil velocity is significantly increased compared to control 24-hours post infection. Immunostaining image of 6 weeks infected gastric mucosal section showing neutrophils stained with anti-Ly6G-488 (green) and H. pylori-mRFP (red), DAPI (blue). Immunohistology of non-infected gastric mucosa (E), scale bar is 20 μm. (F) 24h after infection, showing H. pylori (magenta) localized inside the crypts and neutrophils (yellow). Scale bar is 10 μm. (G) 6 weeks after infection, showing H. pylori (red) located inside the crypts and neutrophils (green), DAPI (nucleus), scale is 20 μm. The arrows indicate the localization of the H. pylori inside the crypts. (H) Quantification of neutrophil influx after 24 hours of H. pylori infection and decrease after 6 weeks of infection. n = 4 mice. ****p<0.0001, ***p<0.001, **p<0.01, *p<0.05, or not significant (ns). One way ANOVA t-test. Mean ± S.D.

