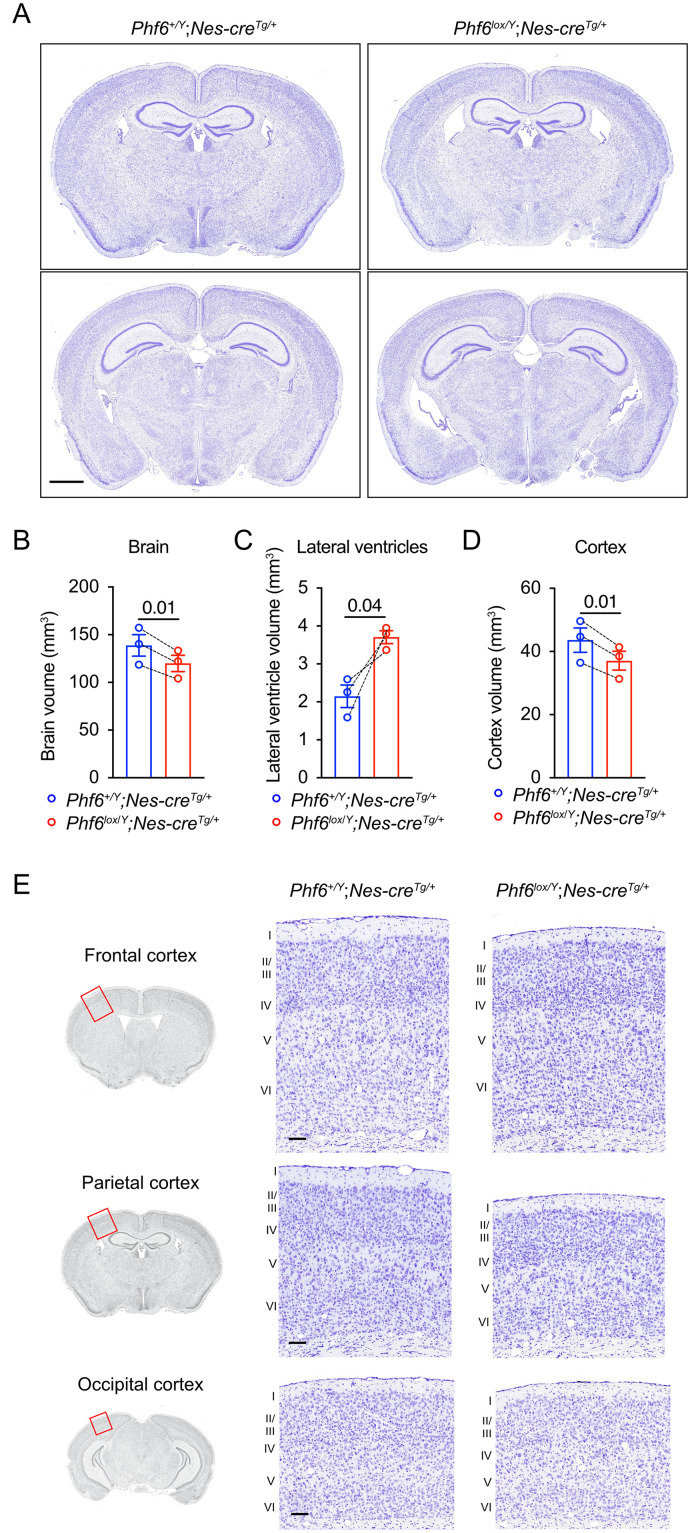
Fig 3. Reduced brain size and enlarged lateral ventricles in adult Phf6lox/Y;Nes-creTg/+ mice.
(A) Images of 10 μm brain serial sections stained with cresyl-violet from a representative Phf6lox/Y;Nes-creTg/+ and a Phf6+/Y;Nes-creTg/+ paired control. Adult brains from 3 Phf6lox/Y;Nes-creTg/+ mice were fixed 17 to 37 days after onset of seizures, each with an age-matched Phf6+/Y;Nes-creTg/+ control (394 to 483 days old). Scale bar = 1 mm. (B-D) Volumes of the brain, lateral ventricles and cortex in Phf6lox/Y;Nes-creTg/+ versus Phf6+/Y;Nes-creTg/+ mice showing data here corresponding to the brain region spanning the lateral ventricles. Volumes were measured for the brain, lateral ventricle and cortex area in seven matched sections per animal across sections spaced at approximately 480 μm intervals. N = 3 age-matched pairs of Phf6lox/Y;Nes-creTg/+ mouse and Phf6+/Y;Nes-creTg/+ mice. Bars in the graph show the mean ± sem of each genotype, while lines between individual data points join each Phf6lox/Y;Nes-creTg/+ animal to its paired control. Data were analysed by a two-tailed paired t-test. (E) Images showing representative cresyl-violet-stained sections of the cerebral cortex from the brains of Phf6lox/Y;Nes-creTg/+ and Phf6+/Y;Nes-creTg/+ mice. The approximate region of the cortex area shown is indicated by the red rectangles on the coronal images on the left. Numbers next the sections indicate the cortical layers I to VI. Scale bar = 100 μm. Related data are shown in S3, S5 and S6 Figs; assessment of interneuron number, Purkinje cell number and incidence of hydrocephalus are displayed in S2, S4 and S7 Figs, respectively.

