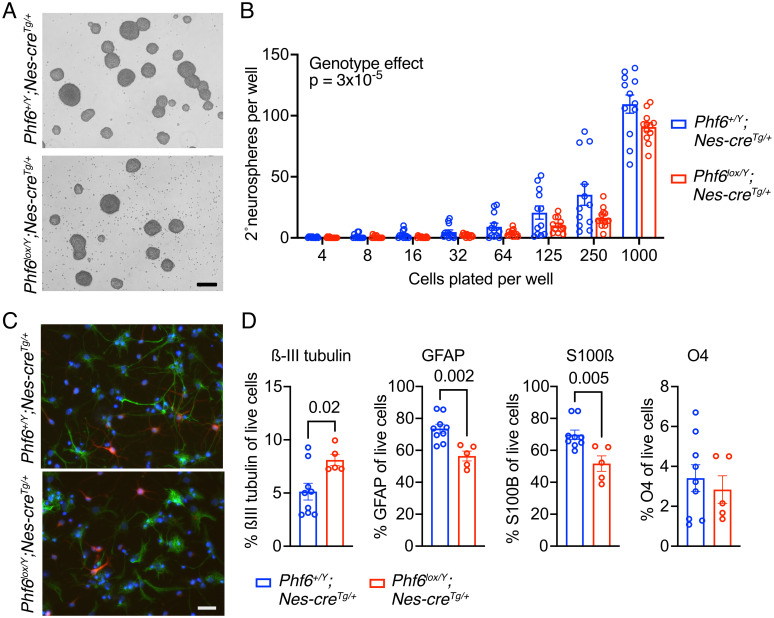
Fig 5. Neural stem cell self-renewal and differentiation.
(A) Representative bright field images of neural stem and progenitor cells (NSPCs) isolated from the dorsal telencephalon of E12.5 Phf6+/Y;Nes-creTg/+ and Phf6lox/Y;Nes-creTg/+ embryos and grown as neurospheres in proliferation medium with FGF2 and EGF. Scale bar equals 220 μm. (B) Secondary neurosphere formation assay of Phf6+/Y;Nes-creTg/+ and Phf6lox/Y;Nes-creTg/+ NSPCs plated at the cell numbers per 96-well plate well as indicated. (C) Representative immunofluorescence images of Phf6+/Y;Nes-creTg/+ and Phf6lox/Y;Nes-creTg/+ NSPCs plated on laminin coated slides and grown for 5 days in differentiation medium (without FGF2 or EGF and with FCS) stained for a neuronal marker (ßIII-tubulin, red) and an astrocyte marker (GFAP, green) and counterstained with DAPI. Scale bar equals 25 μm. (D) Flow cytometry assessment of the percentage of neuron (ßIII-tubulin+), astrocytes (GFAP+ and S100ß+) and oligodendrocytes (O4+) in Phf6+/Y;Nes-creTg/+ and Phf6lox/Y;Nes-creTg/+ NSPCs plated on laminin coated slides and grown for 5 days in differentiation medium. N = NSPC cell isolates from 4 embryos per genotype cultured in triplicates (B) and NSPC cell isolates from 9 Phf6+/Y;Nes-creTg/+ and 5 Phf6lox/Y;Nes-creTg/+ embryos (D). Data are depicted as means ± sem. Data were analysed by two-factorial ANOVA (B) or unpaired two-tailed Student’s t-test (D). Related data are displayed in S11 and S12 Figs.

