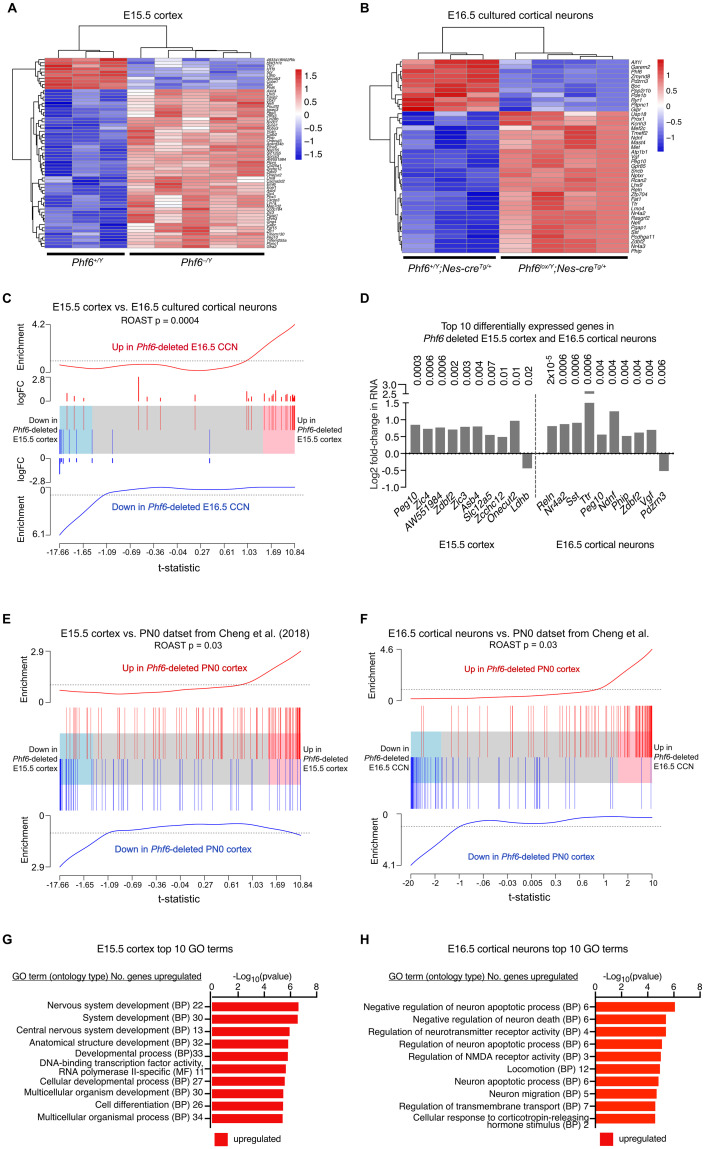
Fig 6. RNA-sequencing reveals PHF6 regulated genes in the foetal cerebral cortex.
(A) Heatmap showing differentially expressed genes between N = 3 Phf6+/Y and 5 Phf6–/Y E15.5 cortices. Values are row-wise z-scores. (B) Heatmap showing differentially expressed genes between N = 3 Phf6lox/Y;Nes-creTg/+ and 4 Phf6+/Y;Nes-creTg/+ E16.5 cortical neuron isolates. Values are row-wise z-scores. (C) Barcode plot showing correlation between the genes differentially expressed in the Phf6–/Y vs. Phf6+/Y E15.5 cortex and in the Phf6lox/Y;Nes-creTg/+ vs. Phf6+/Y;Nes-creTg/+ E16.5 cultured cortical neurons. The horizontal axis shows the t-statistic for all genes in the Phf6-deleted E15.5 cortex and the blue and red shaded areas are genes that tend towards down- or upregulation respectively in the Phf6 deleted E15.5 cortex. The vertical lines represent the genes differentially expressed in the E16.5 Phf6 deleted cultured cortical neurons. Worms show the relative enrichment of differentially expressed genes in the E16.5 dataset among the differentially expressed genes in the E15.5 dataset. The data sets are positively correlated (genes tend to be similarly up- or downregulated in the same direction). ROAST p-value shown. (D) Log2-fold change in RNA levels of the top 10 differentially expressed genes by FDR in Phf6–/Y vs. Phf6+/Y E15.5 cortex and Phf6lox/Y;Nes-creTg/+ vs. Phf6+/Y;Nes-creTg/+ E16.5 cortical neurons. FDR shown above bars. (E,F) Barcode plots showing correlation between differentially expressed genes for indicated datasets. The horizontal axis shows moderated t-statistics for all genes in either the Phf6-deleted E15.5 cortex (E) or the E16.5 cultured cortical neuron dataset (F). The blue and red shaded areas represent genes that tend towards down or upregulation. The vertical lines represent the genes differentially expressed in the Phf6-deleted PN0 cortex samples described by Cheng and colleagues [31]. Worms show the relative enrichment of differentially expressed genes of PN0 genes among the differentially expressed genes of the E15.5 and E16.5 datasets. In each case, the data sets are positively correlated, i.e., genes are generally differentially expressed in the same direction. P-values are from ROAST gene set tests. (G,H) Top 10 enriched GO terms in the Phf6-deleted E15.5 cerebral cortex (G) and E16.5 cultured cortical neurons (H). BP = biological process, MF = molecular function. The analysis of RNA sequencing data is described in the methods section. FDR < 0.05 was considered significant. Related data are shown in S13 and S14 Figs and in S3 and S4 Tables.

