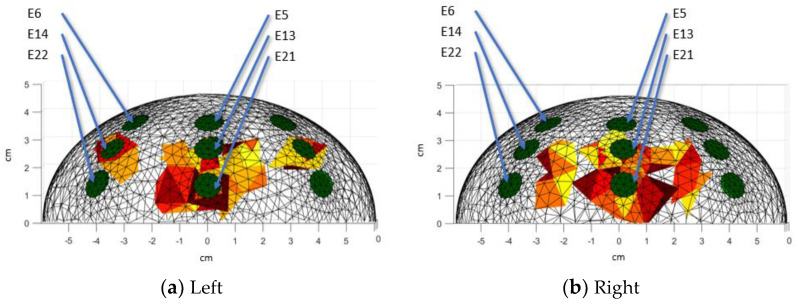
Figure 13.
3D reconstructions: Front view. Red colors represent the e-tumors, green colors represent the position of the electrodes. Warm-toned color scales (such as red, yellow, and orange) are commonly used in 3D visualizations to represent the e-tumor, enhancing the clarity of spatial representation. These colors are selected due to their association with higher intensity regions, making them suitable for highlighting areas of interest.

