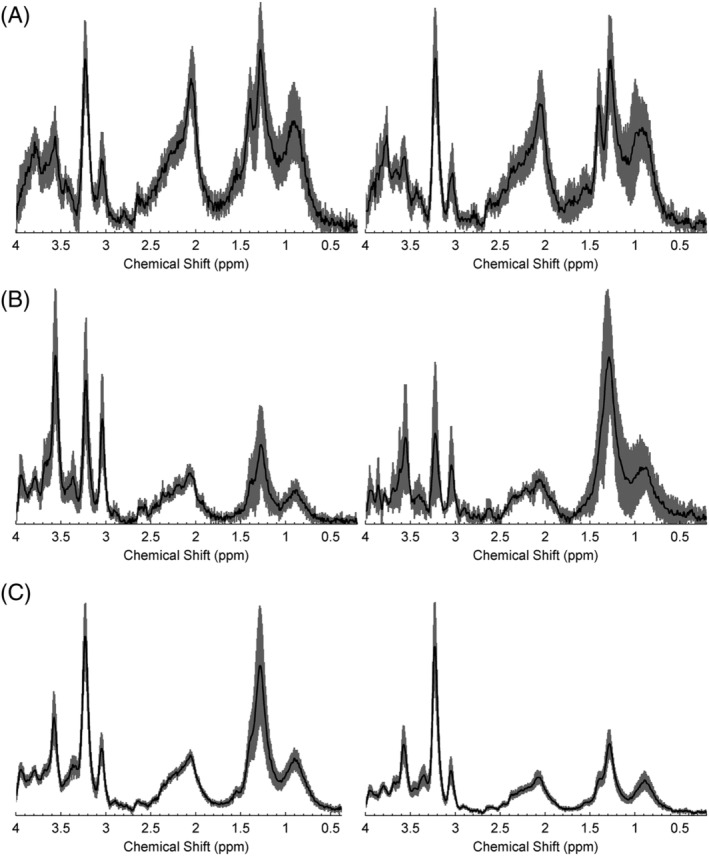
FIGURE 2.

Comparison of mean spectra from the training (left) and prospective testing (right) cohorts for (A) pilocytic astrocytomas, (B) ependymomas and (C) medulloblastomas, with 95% confidence intervals indicated by the shaded region

Comparison of mean spectra from the training (left) and prospective testing (right) cohorts for (A) pilocytic astrocytomas, (B) ependymomas and (C) medulloblastomas, with 95% confidence intervals indicated by the shaded region