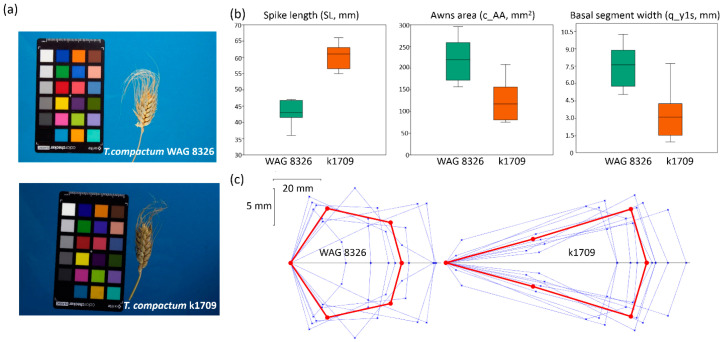
Figure 5.
Differences in the morphometric characteristics of the spike in T. compactum accessions WAG 8326 and k1709. (a) Examples of images of two spikes at the same scale. (b) Box and whisker plots for the distribution of spike traits in two accessions (spike length, awn area and basal segment width). (c) Visual representation of the spike quadrangle models for individual WAG 8326 and k1709 spikes (thin blue lines) and average model parameters (red lines). Vertical and horizontal scales are shown in the upper left part of the panel.

