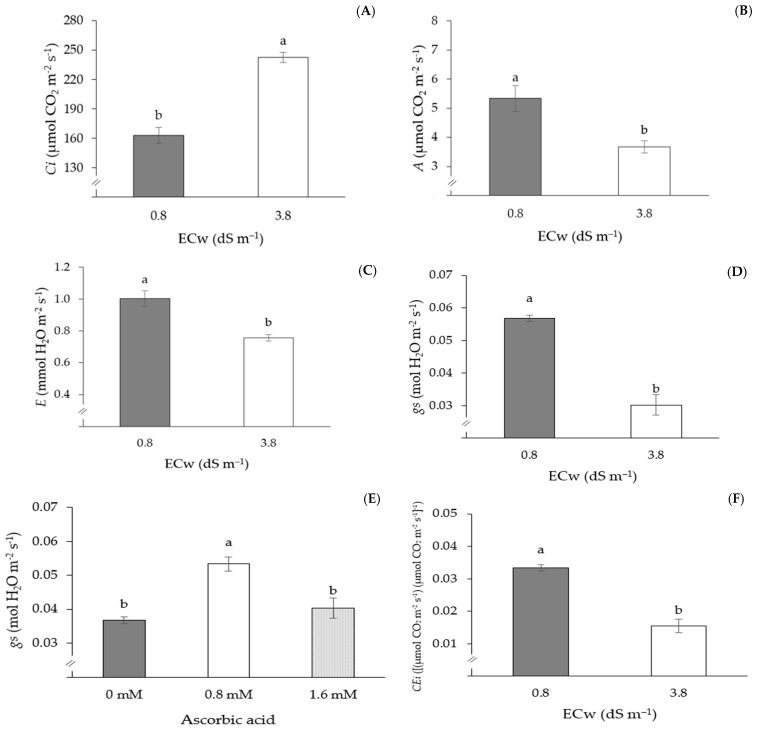
Figure 4.
Internal CO2 concentration—Ci (A), CO2 assimilation rate—A (B), transpiration—E (C), stomatal conductance—gs (D), and instantaneous carboxylation efficiency—CEi (F) as a function of water electrical conductivity levels (ECw), and gs (E) as a function of AsA concentrations, 150 days after transplantation. Means followed by the same letter did not differ statistically from each other according to the Tukey test (p ≤ 0.05). The error bars represent standard error (n = 3).

