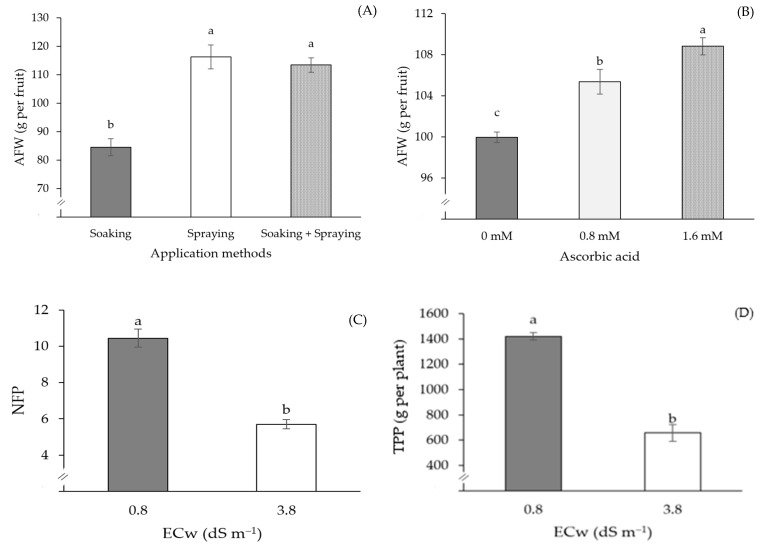
Figure 8.
Average fruit weight—AFW as a function of the application methods (A) and of AsA concentrations (B), number of fruits per plant—NFP (C), and total production per plant—TPP (D) as a function of water electrical conductivity levels (ECw), at 180 days after transplanting. Means followed by the same letter did not differ statistically from each other according to the Tukey test (p ≤ 0.05). The error bars represent standard error (n = 3).

