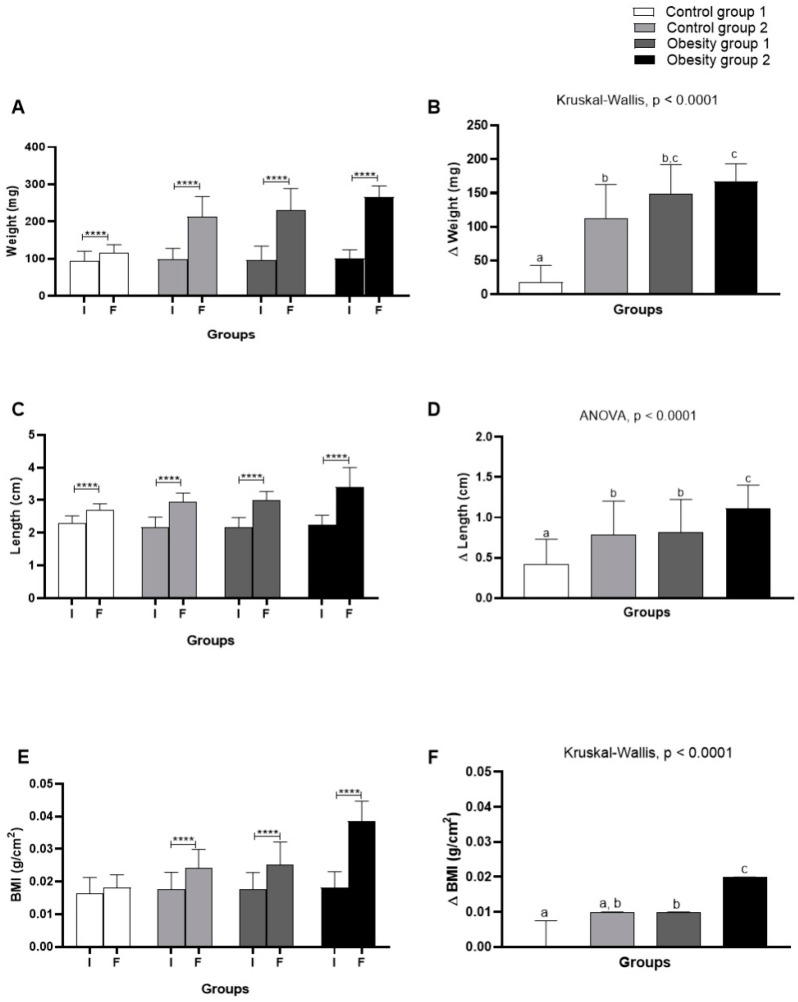
Figure 4.
Comparison of initial (I) and final (F) assessment and variation (Δ) of body weight, length, and body mass index (BMI) of adult zebrafish (three months) with diet-induced obesity (DIO) for eight weeks. (A) Weight; (B) weight variation; (C) length; (D) length variation; (E) BMI; (F) BMI variation. Values are expressed as mean (standard deviation). n = 50 adult animals per group. Letters a, b, and c represent statistical differences in the comparison between groups. Equal letters indicate no significant difference between the groups evaluated for each parameter (Asterisks: **** p = 0.0001). Control group 1: fed with Artemia sp. (first month: 15 mg/day/fish and in the second month 30 mg/day/fish); control group 2: fed with commercial food (3.5% of the group’s average weight); obesity group 1: overfed with powdered egg yolk mixed with soybean oil (2.5:1 w/w)—5% of average body weight; obesity group 2—overfed with Artemia sp. in the first month (60 mg/day/fish) and in the second month (120 mg/day/fish). BMI: body mass index.

