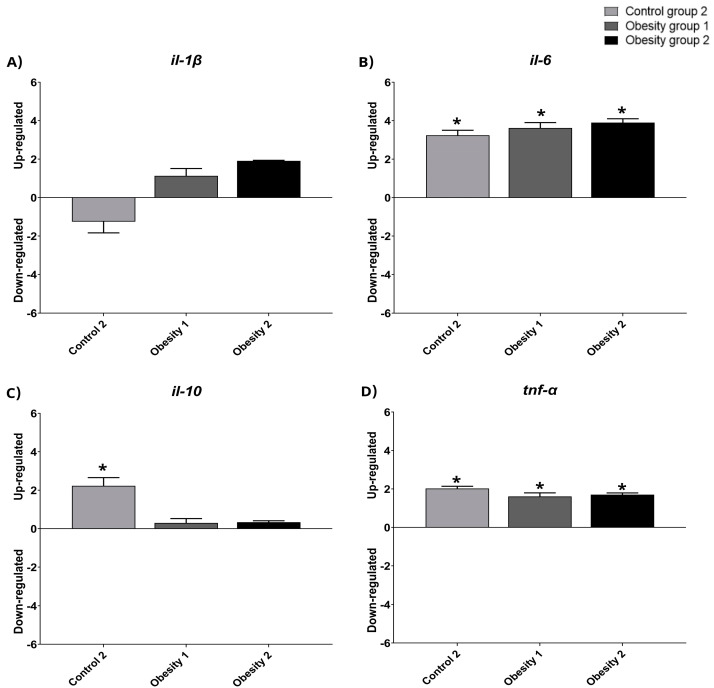
Figure 9.
Relative gene expression values of inflammatory markers in visceral adipose tissue in adult female zebrafish (three months) with diet-induced obesity (DIO) for eight weeks. Qualitative data and normalization with control group 1. Control group 2: fed with commercial food (3.5% of the group’s average weight); obesity group 1: overfed with powdered egg yolk mixed with soybean oil (2.5:1 w/w)—5% of average body weight; obesity group 2—overfed with Artemia sp. in the first month (60 mg/day/fish) and in the second month (120 mg/day/fish). Asterisks indicate significant statistical differences. (A): il-1 β: interleukin 1 beta; (B): il-6: interleukin 6; (C): il-10: interleukin 10; (D): tnf-α: tumor necrosis factor alpha. Down-regulated: low gene expression. Up-regulated: high gene expression.

