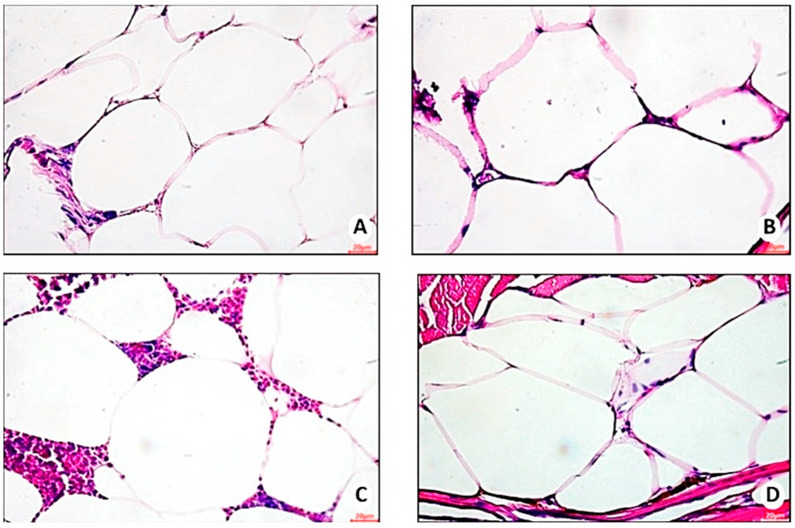
Figure 11.
Representative photomicrograph, at 40× using a 20 µm objective, of hypertrophied adipocytes in visceral adipose tissue of zebrafish with diet-induced obesity (DIO) for eight weeks (n = 10 per group). (A) Control group 1: fed with Artemia sp. (first month: 15 mg/day/fish and in the second month 30 mg/day/fish); (B) control group 2: fed with commercial food (3.5% of the group’s average weight); (C) obesity group 1: overfed with powdered egg yolk mixed with soybean oil (2.5:1 w/w)—5% of average body weight; (D) obesity group 2—overfed with Artemia sp. in the first month (60 mg/day/fish) and in the second month (120 mg/day/fish).

