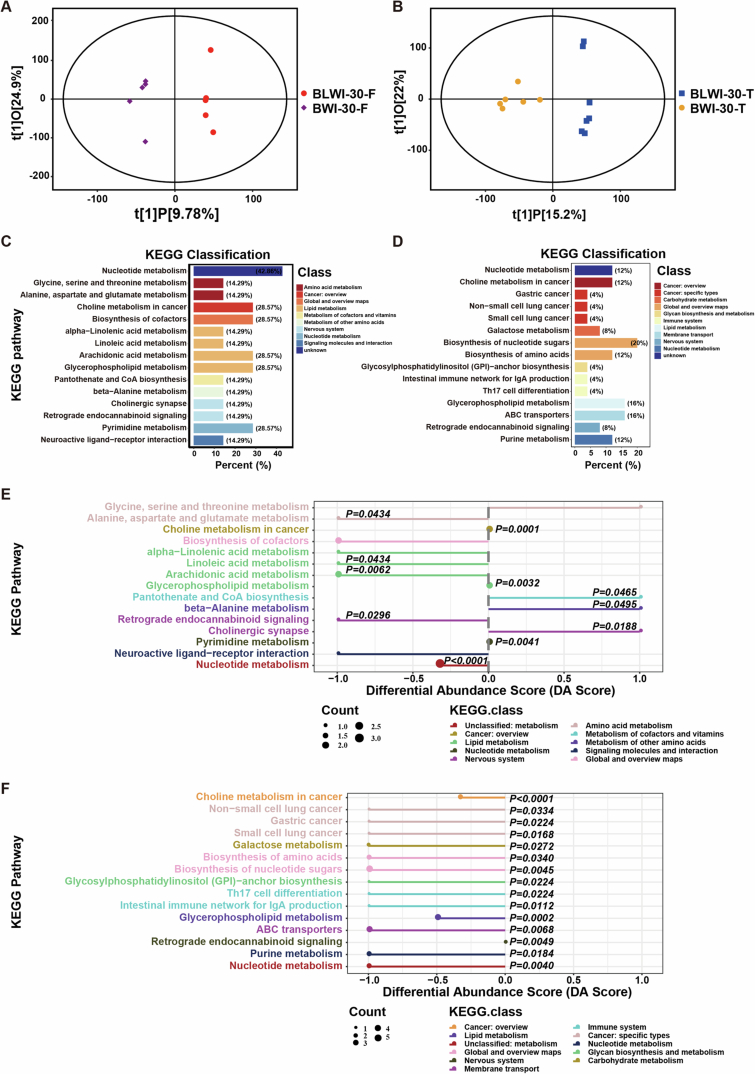
Figure EV4. Metabolome differences in pig brain tissues with and without simultaneous hepatic ischemia.
(A) Scatter plot depicting orthogonal projections to latent structures-discriminant analysis (OPLS-DA) results for the frontal lobe comparing the BLWI-30 and BWI-30 groups. (B) Scatter plot depicting the OPLS-DA data for the temporal lobe comparing the BLWI-30 and BWI-30 groups. (C, D) The bar plot displays the KEGG annotation of detected metabolites for the frontal lobe (C) and temporal lobe (D). The x-axis represents the percentage of identified metabolites in each KEGG class. (E, F) Depiction of overall changes in differential metabolites within a specific pathway for the frontal lobe (E) and temporal lobe (F). The Differential Abundance Score (DA Score) was calculated as the ratio of the difference between the upregulated metabolite count and the downregulated metabolite count on a specific pathway to the total count of metabolites on that pathway. (A–F) Frontal lobe: BWI-30, n = 5, BLWI-30, n = 5; temporal lobe: BWI-30, n = 6, BLWI-30, n = 7. All replicates shown were biological replicates. P values were calculated by Fisher’s exact test (E, F) using the ggplot2 R package.

