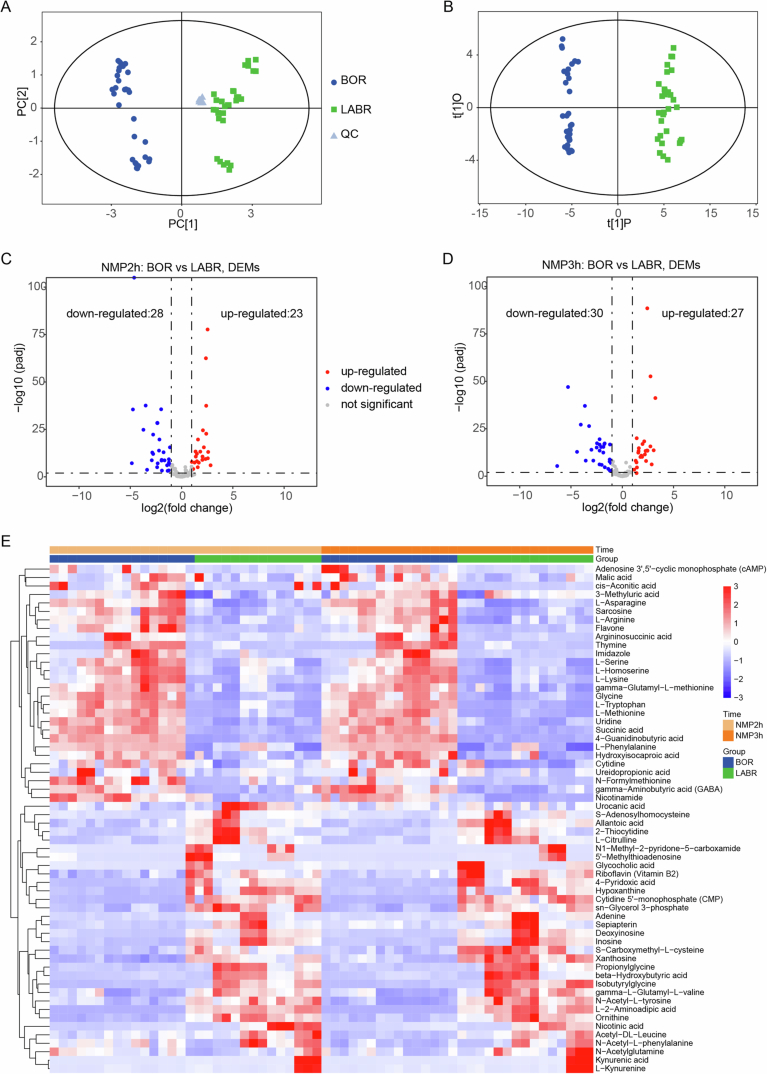
Figure EV5. Metabolome differences in the perfusate serum during ex vivo pig brain NMP with and without a functioning liver support.
(A) Principal component analysis (PCA) showcasing the global variation within and between groups for the overall samples. (B) Scatter plot of orthogonal projections to latent structures-discriminant analysis (OPLS-DA) illustrating the differences between groups. (C, D) Volcano plot demonstrating the differential metabolites after 2 and 3 h of normothermic machine perfusion (NMP). (E) Heatmap displaying the z-score distribution of significantly different metabolites across various time points, with each row representing a metabolite. The heatmap was generated with the DESeq2 R package. (A–E) n = 5 pigs in each group, triplicate perfusate samples for technical replicates in each pig. (C, D) P values were calculated by the Wald test using the DESeq2 R package.

