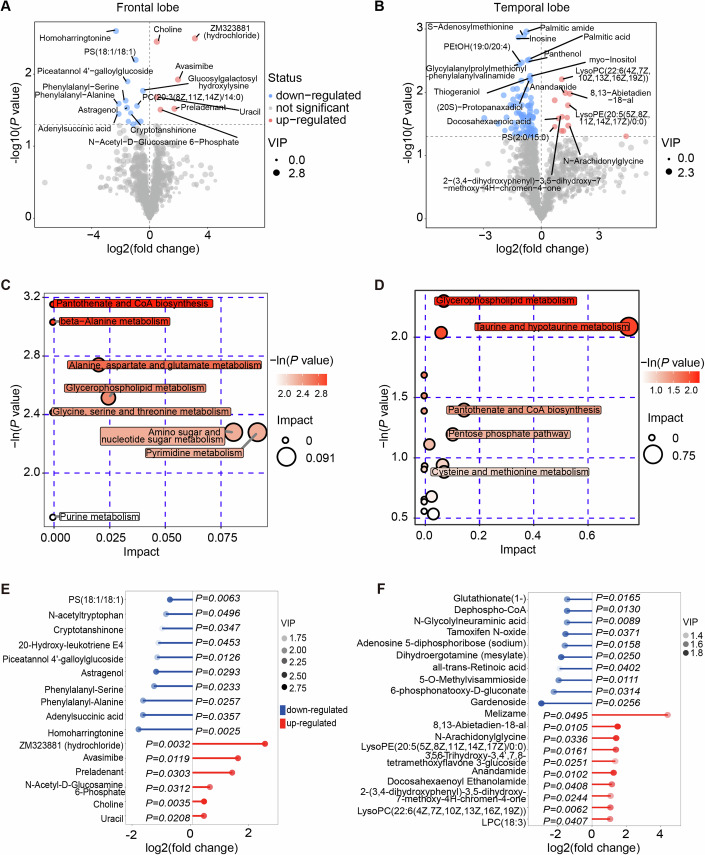
Figure 6. Metabolic differences in pig brain tissues with and without simultaneous hepatic ischemia by UHPLC-QTOFMS.
(A, B) Volcano plot illustrating the differential metabolites with secondary mass spectrometry (MS2) names in the frontal lobe (A) and temporal lobe (B) of the pig brains with and without simultaneous hepatic ischemia. Significant metabolic alterations (P value < 0.05, VIP > 1) were denoted in red or blue, respectively. (C, D) Bubble plot displaying the enriched metabolic pathways for increased metabolites in the frontal lobe and temporal lobe, respectively. The value on the x-axis and the size of the circle indicates the impact of the difference. The value on the y-axis and the color indicates the significance of enrichment in −ln(P). (E, F) Matchstick plot illustrating the top metabolic alterations with lowest P values in the frontal lobe (E) and temporal lobe (F). The x-axis displays the log2(fold change) of BLWI to BWI. Each item’s VIP score is denoted by color. (A–F) Frontal lobe: BWI-30, n = 5, BLWI-30, n = 5; temporal lobe: BWI-30, n = 6, BLWI-30, n = 7. All replicates shown were biological replicates. P values were calculated by the t-test (A, B, E, F) and Fisher’s exact test (C, D) using the ggplot2 R package. Source data are available online for this figure.

