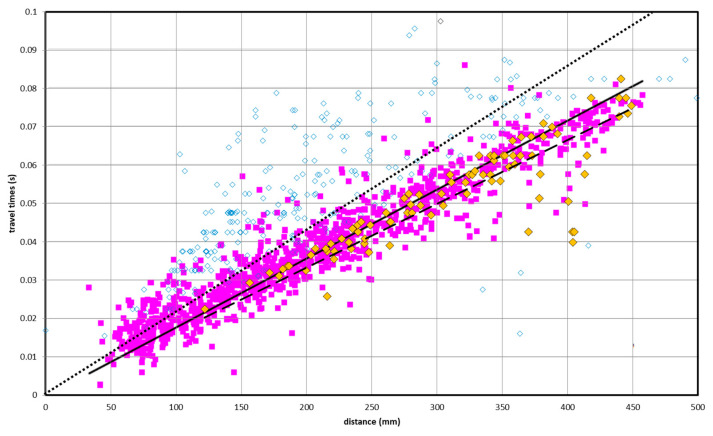
Figure 5.
Measured ultrasonic travel times versus source–receiver distance. The 2012 data (in magenta), acquired only in the lower part of the statue, are compared with those acquired in 2021 on the whole surface of the statue (white diamonds) and with those, among these, acquired in the lower part of the statue (yellow diamonds). The solid line represents the linear regression of the 2012 data, while the dotted and dashed lines represent, respectively, the linear regression of the entire 2021 dataset and of only the data acquired in the lower part of the statue.

