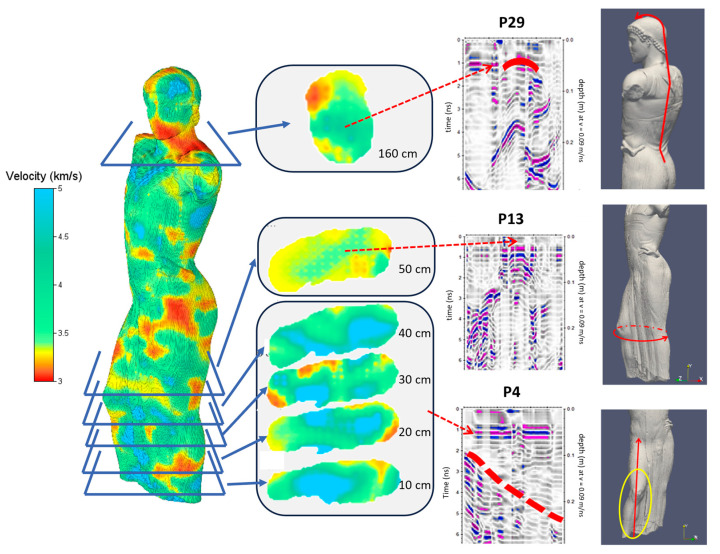
Figure 11.
Joint interpretation of GPR and UST results. The red dashed arrows highlight the correspondences between US anomalies and GPR reflections. In the GPR profiles, he reflection amplitudes are represented in a color scale from blue (maximum negative amplitude) to magenta (maximum positive amplitude); the red continuous lines indicate the traces of GPR profiles on the surface of the statue; the continuous red line in P29 highlight the reflection of a metal pin.

