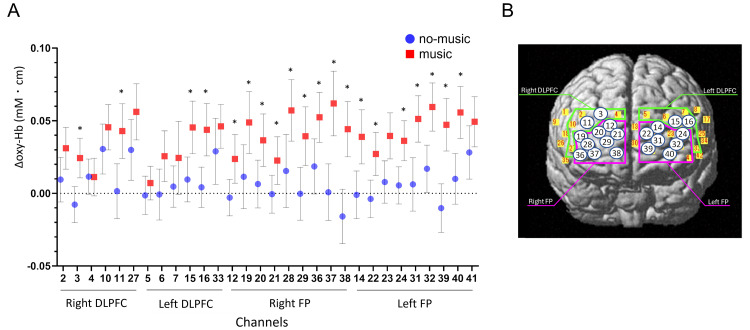
Figure 4. (A) Changes in oxy-Hb levels under the music and no-music conditions during the go/no-go task from the go task in the older group. (B) The location of the channels in which significant increases in oxy-Hb levels were observed under the music condition in older adults. The numbers in the circle indicate the channels.
DLPFC: dorsolateral prefrontal cortex; FP: frontal pole; oxy-Hb: oxyhemoglobin
Error bars indicate 95% CI. *p < 0.05 adjusted using the Bonferroni method versus no-music condition.

