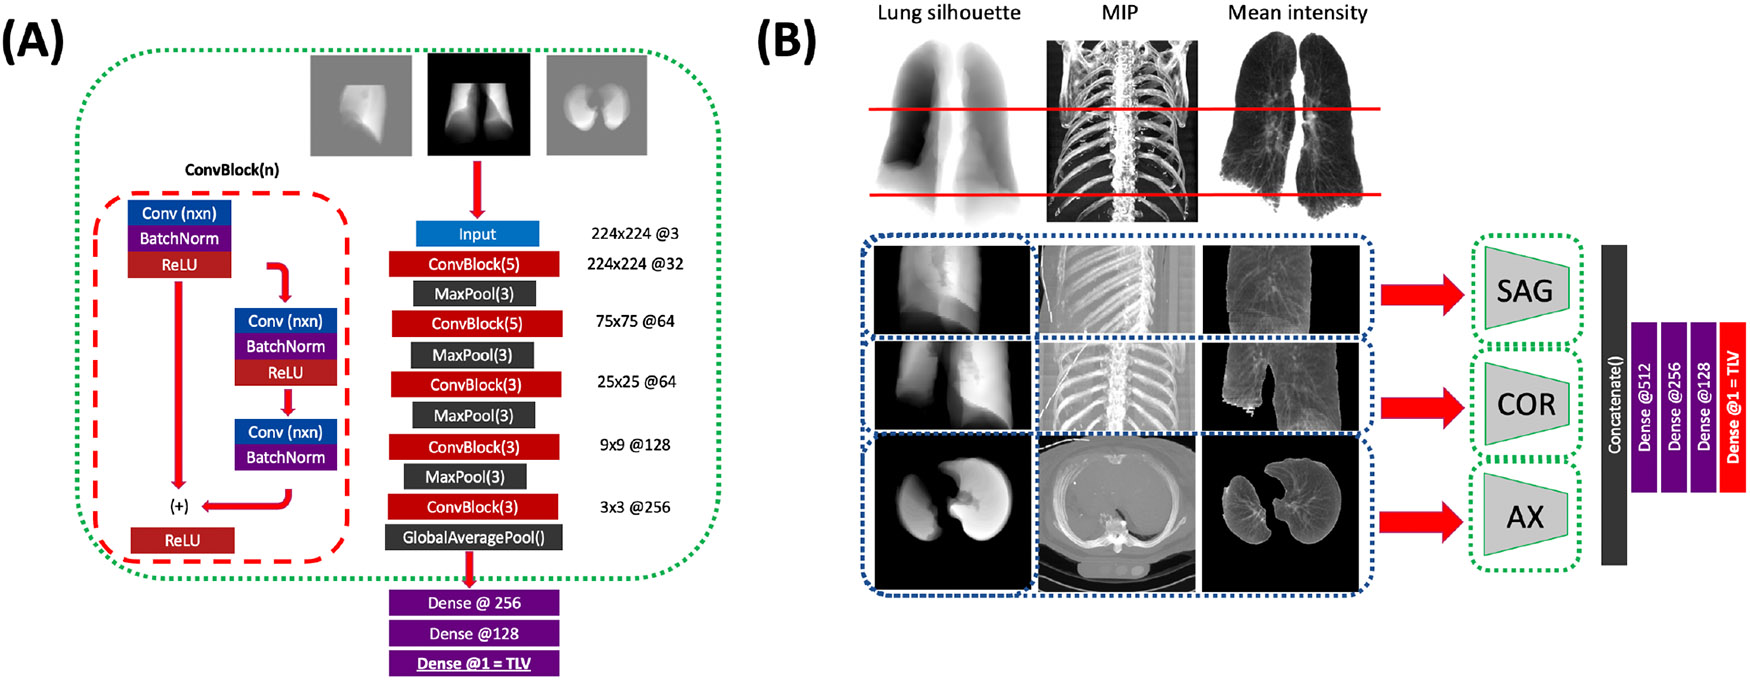
Figure 2: Schematic of our multi-view CNN model.

(A) for each imaging plane, a separate CNN composed of alternating residual and max-pooling blocks is trained to estimate TLV from the single view. (B) The three planar CNNs are frozen (green dashes), and their bottleneck outputs are concatenated and passed to dense layers to generate the final TLV estimate. Models are trained on either the lung silhouette alone (input, left column) or on the lung silhouette, MIP (center), and lung mean intensity (right).
