
Figure 3:
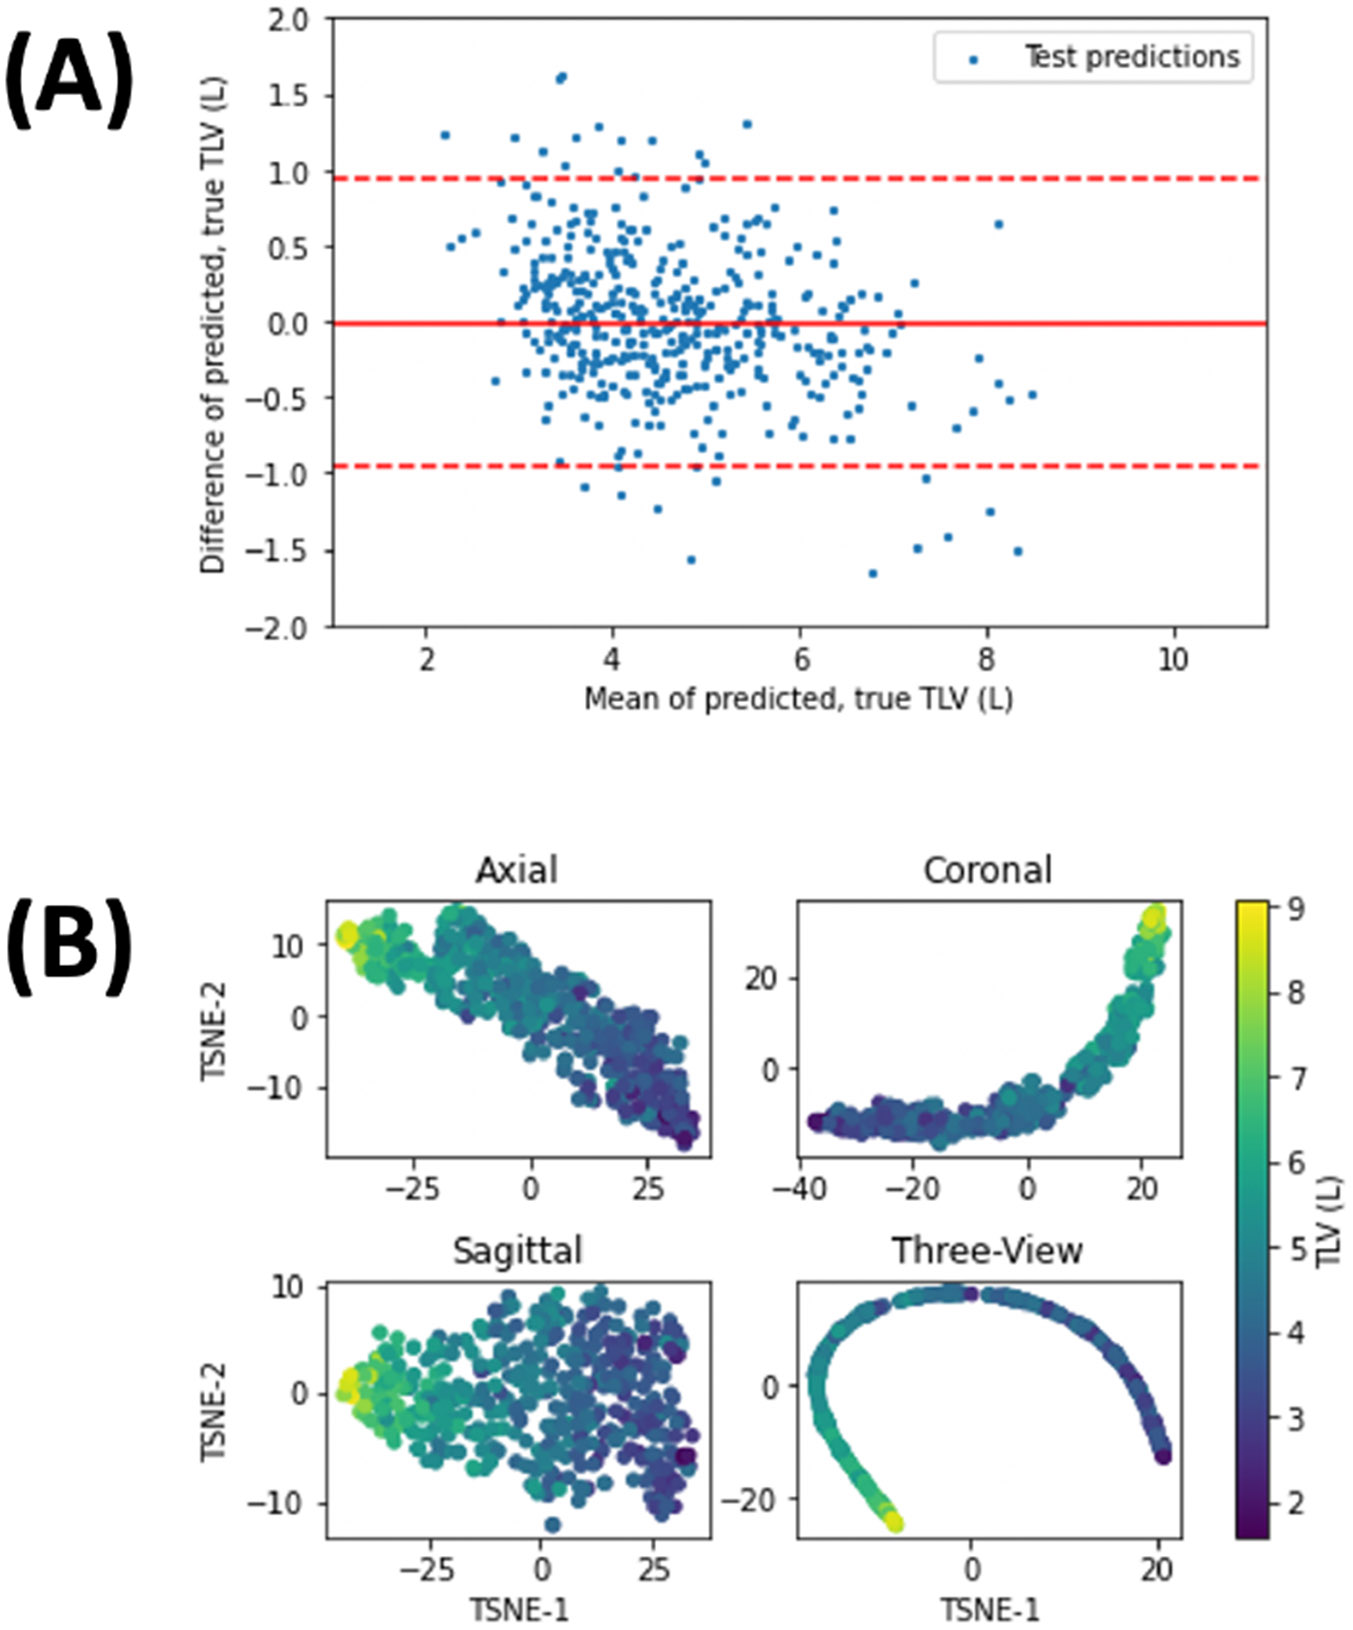
(A) Bland-Altman plot for test-set predicted and ground-truth TLV (n = 431), from the best-performing network. Solid line denotes the mean residual, while dashed lines denote the 95% confidence interval. (B) t-SNE plots of the latent-space representation of test-set examples for the single views and the multi-view CNNs, color-coded by TLV.