Abstract
Magnetic resonance imaging (MRI) is now an essential tool in the field of neuroscience involving non-human primates (NHP). Structural MRI scanning using T1-weighted (T1w) or T2-weighted (T2w) images provides anatomical information, particularly for experiments involving deep structures such as the basal ganglia and cerebellum. However, for certain subcortical structures, T1w and T2w image contrasts are insufficient for their detection of important anatomical details. To better visualize such structures in the macaque brain, we applied a relatively new method called quantitative susceptibility mapping (QSM), which enhances tissue contrast based on the local tissue magnetic susceptibility. The QSM significantly improved the visualization of important structures, including the ventral pallidum (VP), globus pallidus external and internal segments (GPe and GPi), substantia nigra (SN), subthalamic nucleus (STN) in the basal ganglia and the dentate nucleus (DN) in the cerebellum. We quantified this the contrast enhancement by systematically comparing of contrast-to-noise ratios (CNRs) of QSM images relative to the corresponding T1w and T2w images. In addition, QSM values of some structures were correlated to the age of the macaque subjects. These results identify the QSM method as a straightforward and useful tool for clearly visualizing details of subcortical structures that are invisible with more traditional scanning sequences.
Keywords: Non-human primate, Macaque monkey, MRI, QSM, Magnetic susceptibility
1. Introduction
Magnetic resonance imaging (MRI) plays an essential role in neuroscience research involving non-human primates (NHP). Structural MRI scanning, which typically employs T1-weighted (T1w) or T2-weighted (T2w) image contrasts, has become a routine presurgical procedure for NHP experiments for precise surgical targeting. Researchers use MRI to target brain structures of interest for the placement of both recording microelectrodes, for neural recordings, and injection cannulae, for introducing a range of neuroactive drugs and virally encoded proteins (Amita et al., 2020; Bonaventura et al., 2019; El-Shamayleh and Horwitz, 2019; Eldridge et al., 2016; Maeda et al., 2020; Nagai et al., 2016). Prior to the advent of MRI, NHP neurophysiologists relied on postmortem histological evaluation of brain sections under the microscope to conclusively determine the area targeted by their recordings or injections. The combined use of MRI for presurgical planning and postsurgical, in vivo assessment of experimental accuracy have greatly increased the accuracy and efficiency of neurophysiology experiments in non-human primates.
Increasingly, modern viral methods utilize anatomical MRI data to identify targets for stereotaxic injection (Fredericks et al., 2020). While some targets are readily visible using standard MRI contrast, others are not. For example, it has been virtually impossible to use T1w or T2w contrasts to detect boundaries within subcortical nuclei of the basal ganglia (e.g., the globus pallidus, the substantia nigra) and the cerebellum (e.g., the dentate nucleus). This is because the signal intensities of these gray matter structures are, in fact, similar to those of the white matter around them. As a result, many functionally distinct substructures whose differential targeting may be of potential interest remain undifferentiated, even in high quality MRI atlases of the macaque brain (Seidlitz et al., 2018).
Quantitative susceptibility mapping (QSM) is a relatively new MRI acquisition approach for enhancing tissue contrast (Liu et al., 2011; Wu et al., 2012; Li et al., 2011). This method exploits subtle differences in local tissue magnetic susceptibility, allowing for the visibility of otherwise hidden gray matter substructures, particularly those rich in iron. Quantitative susceptibility values across the brain are reconstructed from the MRI phase images acquired using a 3D gradient echo (GRE) sequence. Previous human studies have shown that the QSM method permits substantial visualization of internal tissue contrast for structures such as the basal ganglia, whose components vary in their level of iron deposition. For example, within the basal ganglia, this method allows for the visualization and segmentation of gray matter structures with similar T1w and T2w contrasts, such as the globus pallidus external segment (GPe), globus pallidus internal segment (GPi), subthalamic nucleus (STN), substantia nigra (SN) (Liu et al., 2013b). As a result, the QSM method has been clinically used to guide neurosurgical implantation of electrodes in the STN, a primary target in deep brain stimulation (DBS) for Parkinson’s patients (de Hollander et al., 2014; Dimov et al., 2018). While the QSM should be similarly useful to neuroscientists focusing on these and other subcortical structures in monkeys, to our knowledge this method has not been previously used in NHPs at 3T.
The present study applies the QSM acquisition protocol to the macaque brain in vivo to examine its feasibility and robustness in this species. The results demonstrate clear contrast images to visualize iron-rich subnuclei of the basal ganglia and the cerebellum that are indistinct in T1w and T2w images.
2. Materials and methods
2.1. Subjects
Six adult male rhesus monkeys (Macaca mulatta), including three younger monkeys (M1 (8 years and three months old, 10 kg), M2 (8 years and five months old, 13 kg), and M3 (8 years and five months old, 11 kg)), and three older monkeys (M4 (13 years and four months old, 12 kg), M5 (14 years and six months old, 14 kg), and M6 (14 years and seven months old, 14 kg)), participated in this study. Head post implants were present in three of the six subjects to immobilize the head. All experimental procedures followed National Institutes of Health guidelines and were approved by the Animal Care and Use Committee of the National Eye Institute.
2.2. Animal preparation for MRI
All MR images were acquired under anesthesia to avoid head motion artefact. The monkey’s head was fixed in an MRI-compatible stereotaxic frame. Atropine (0.05 mg/kg, i.m.) was initially injected and ketamine (10 mg/kg, i.m.) and dexmedetomidine (0.01 mg/kg, i.m.) were used for induction of anesthesia. Additional ketamine (5 mg/kg, i.m.) and dexmedetomidine (0.01 mg/kg, i.m.) were injected for maintenance.
2.3. Imaging protocols and QSM reconstruction
MR imaging of all six monkeys was performed in a clinical 3T MR imaging system (MAGNETOM Prisma; Siemens Healthcare, Erlangen, Germany). A 15-channel human knee coil was chosen in this study because it can accommodate most of our experimental monkey subjects who have head posts and recording chambers on the skull. T1w images were acquired using MPRAGE with the following parameters: 0.5 mm isotropic, FOV 128 × 128 × 112 mm, matrix 256 × 256, slices per slab 224, sagittal orientation, number of averages 4, TR 2200 ms, TE 2.23 ms, TI 900 ms, flip angle 8, total acquisition time 47 min 4 s. T2w images were acquired using SPACE (Mugler et al., 2000) with the following parameters: 0.5 mm isotropic, FOV 128 × 128 × 112 mm, matrix 256 × 256, slice per slab 224, TR 3200 ms, TE 562 ms, number of averages 2, total acquisition time 19 min 16 s. QSM was obtained with a 3D multi-echo gradient-echo (GRE) sequence with TR 50 ms, TE: 3.65/10.11/16.73/23.35/29.97/36.59/43.21 ms, bandwidth 280 Hz/pixel, flip angle 15, 0.4 mm isotropic, FOV 128 × 128 × 57.6 mm, matrix 320 × 320 × 144, number of averages 1, total acquisition time 28 min 50 s. These acquisition parameters were the same as a recently published paper except for the numbers of averaging (Autio et al., 2020). Because we assumed the signal-to-noise ratio (SNR) would decrease by using the human knee coil, we doubled the numbers of averaging for T1w (4 times) and T2w (twice).
QSM images were reconstructed from the phase images from 3D GRE with multiple echo, as described previously in detail (Liu et al., 2015; Wang and Liu, 2015) and summarized in Fig. 1A. This reconstruction process consisted of three main steps: (1) Unwrapping of the phase images. This step was necessary because any angle of proton phase shift lying outside the range between −π and π is folded back in the image, and this folding was abundant in raw phase images with longer TE. (2) High-pass filtering of phase image. This step compensated for the dominating susceptibility influence of the tissue-air interface (‘background phase’) and focused instead on local tissue phase images. (3) Dipole deconvolution. This step was performed to map the magnetic susceptibility in each voxel. Many algorithms to solve this dipole inversion problem have been developed (Li et al., 2011; Liu et al., 2009, 2012; Tang et al., 2013; Wharton et al., 2010). In this study, we used the Morphology Enabled Dipole Inversion (MEDI) method (Bollmann et al., 2019; Liu et al., 2011, 2012, 2013a; Liu et al., 2018). These three steps were performed by using the MEDI toolbox in MATLAB2019 (Liu et al., 2012, http://pre.weill.cornell.edu/mri/pages/qsm.html). The QSM images were acquired by following steps shown in READ.m in the MEDI toolbox, in some cases adjusting the CSF (cerebrospinal fluid) mask as necessary. This was accomplished by inspecting the output of the extra_CSF function, and, if the CSF mask was deemed inappropriate, changing the masking threshold. An appropriate threshold level was chosen by examining the R2 star image that comprised the input of the extra_CSF function. A threshold value of 12 was typically used.
Fig. 1.
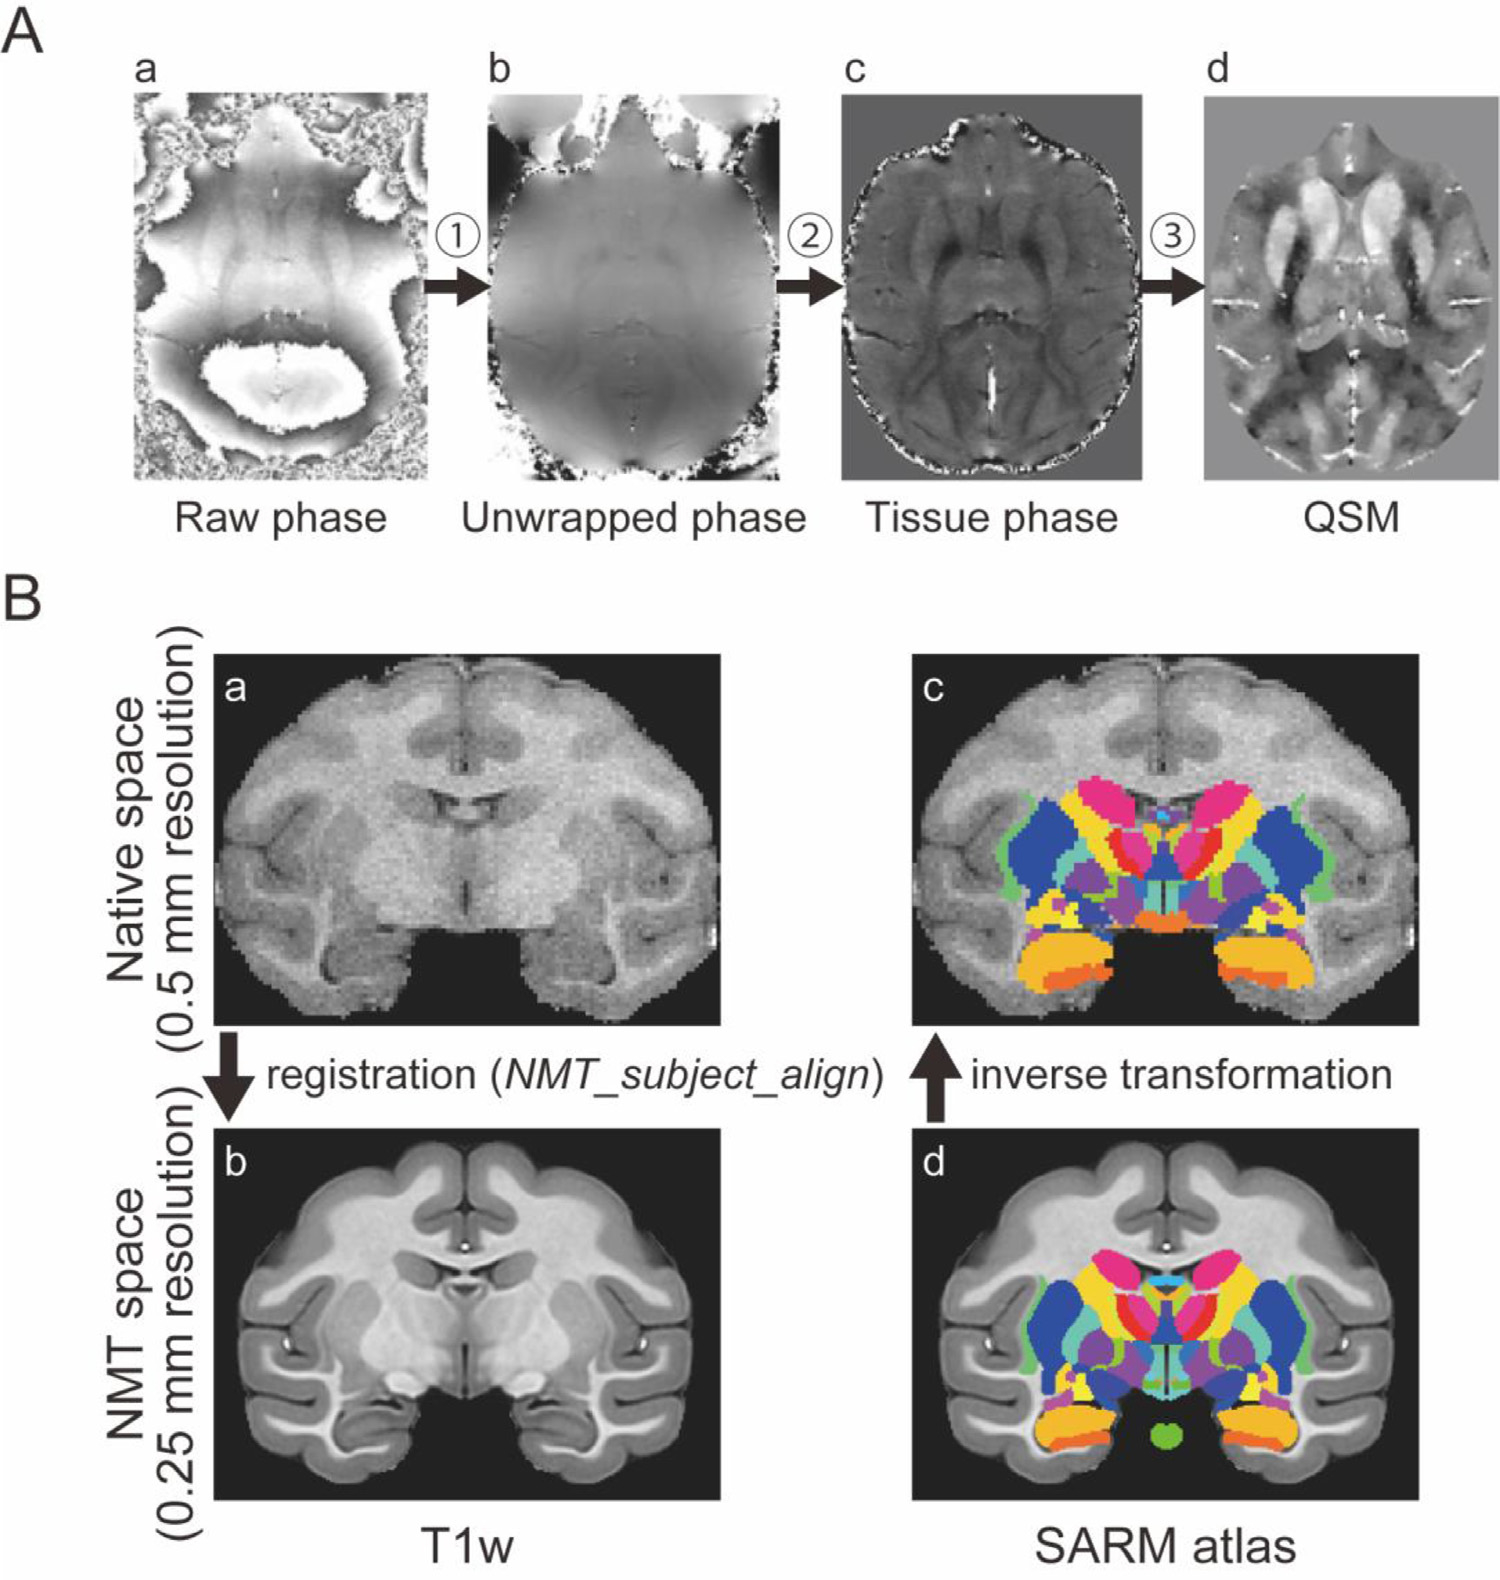
Imaging preprocessing. (A) Overview of QSM processing. QSM is reconstructed from 3D gradient echo phase images with different TE. There are three main steps in the processing from the raw phase image to QSM; 1 unwrapping 2 background phase removal by high-pass filtering, 3 inverse problem solution by performing a dipole deconvolution. (B) Automatic ROI creation using SARM atlas. SARM atlas in NMT space was inversely transformed into each subject’s space (from (d) to (c)) using output from alignment of a subject’s T1w image to NMT (from (a) to (b)).
2.4. Quantitative image evaluation
To evaluate the visibility of the iron-rich subcortical structures, we focused on six subcortical structures, namely the ventral pallidum (VP), globus pallidus external segment (GPe), globus pallidus internal segment (GPi), substantia nigra (SN), subthalamic nucleus (STN) in the basal ganglia, and the dentate nucleus (DN) in the cerebellum. In addition to these six structures of interest, the striatum (caudate nucleus and putamen) and the red nucleus (RN) are also iron-rich structures. However, we excluded the caudate nucleus and putamen from analysis because these structures are readily discernable in T1w and T2w images. The RN was excluded because it was not clearly visualized in younger monkeys in all T1w, T2w, and QSM and we couldn’t create the ROI for the RN. The contrast-to-noise ratios (CNRs) were calculated by the following formula: CNR = |IROI – Iwm|/σwm, where IROI is the average signal intensity of the region of interest (ROI) and Iwm is the average signal intensity of white matter near ROI (Dimov et al., 2018). σwm represents the noise measurement calculated as the standard deviation of Iwm. First, to create ROIs semi-automatically, each subject’s T1w image was aligned to the standard NIMH macaque template (NMT v2.0) using the analysis pipeline (NMT_subject_align) with AFNI software (Cox 1996; Jung et al., 2021; Seidlitz et al., 2018) (Fig. 1 B (a), (b)). Second, the subcortical atlas of the rhesus macaque (SARM) for NMT (Hartig et al., 2021) was inversely transformed to the subject T1w image (Fig. 1B (c), (d)) by AFNI’s 3dNwarpApply with output files from the NMT_subject_align pipeline (inverse of linear transformation matrix and non-linear warp field). Finally, if modification of the ROIs was needed, they were edited manually, mainly on the basis of the QSM images, and confirmed with T1w and T2w images. Among the six targeted structures, it was not necessary to manually adjust the ROIs for the VP, GPe, and GPi. The ROIs of the SN, STN, and DN in all six monkeys needed to be manually adjusted because the SN and STN ROIs were shifted and the DN ROIs were too large to include the surrounding white matter. Examples of automatically created GPe ROIs (acceptable) and SN ROIs (unacceptable) for each monkey are shown in Supplementary Fig. 1. Afterward, these masks were applied to the T1w, T2w, and QSM images for calculating the CNRs after resampling the voxel size of the QSM from 0.4 mm to 0.5 mm which was the same size as the T1w and T2w. We used the left hemisphere for determining ROIs. For measuring the CNR of ROIs, we defined as Iwm within the ipsilateral anterior commissure (AC) (for the VP in Fig. 2), the internal capsule (IC) (for the GPe and GPi in Fig. 3), the optic tract (for the SN and STN in Fig. 4), and the ipsilateral middle cerebellar peduncle (for the DN in Fig. 5).
Fig. 2.
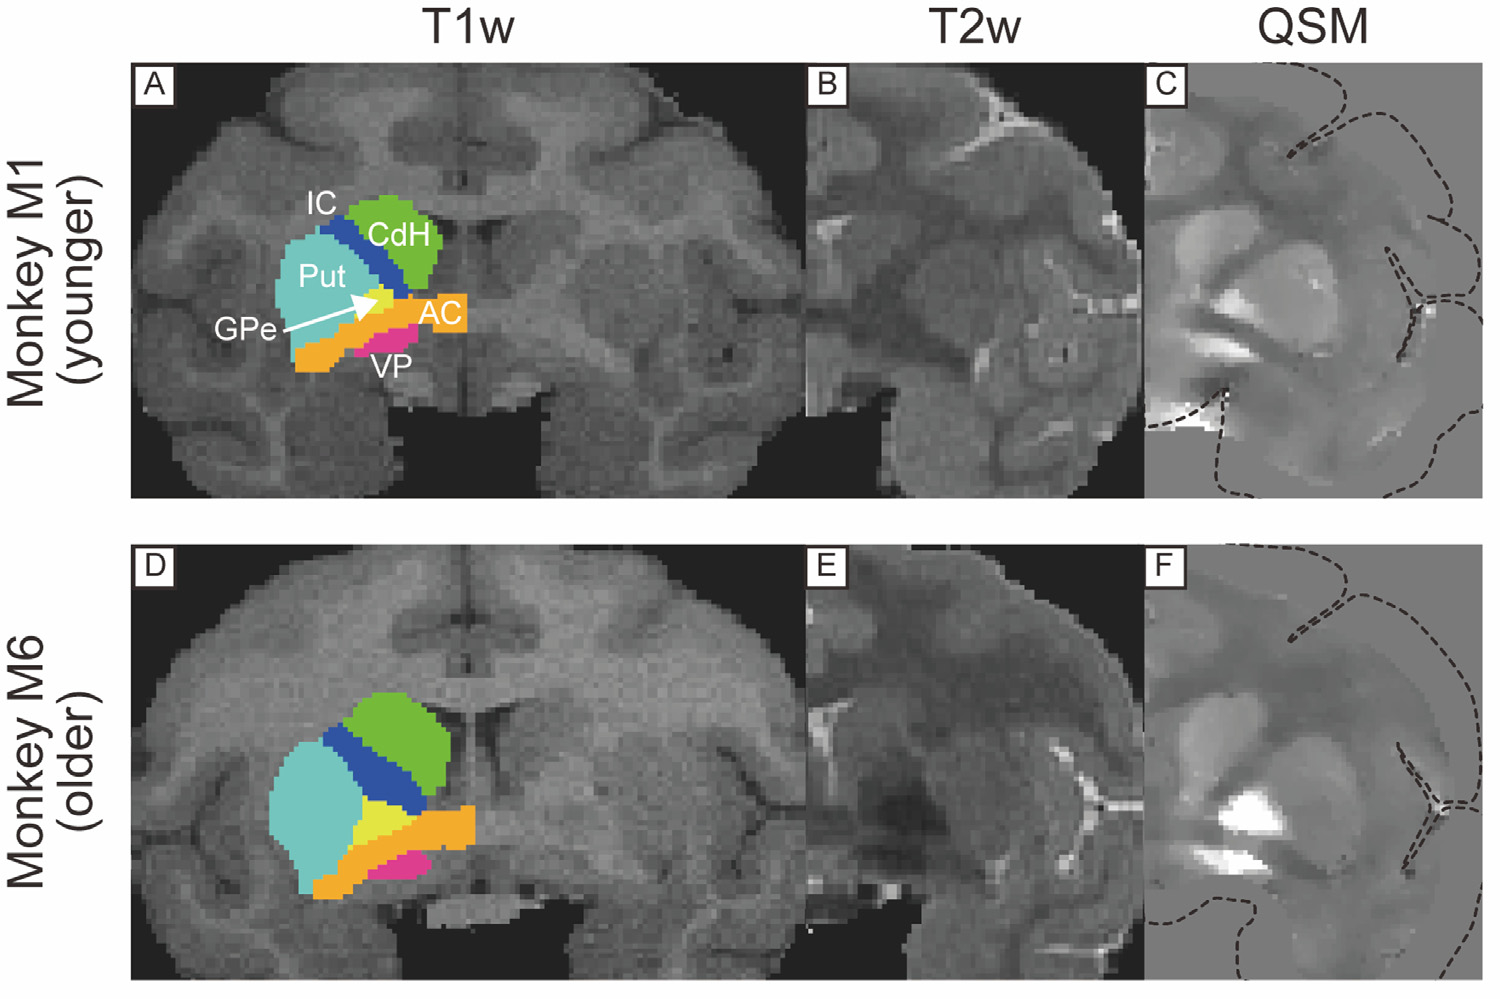
T1w, T2w, and QSM coronal images including anterior commissure (AC) in a younger (A, B, C) and older monkeys (D, E, F). Colored drawings in left hemisphere in T1w images indicate ROIs created from SARM atlas. These were used for calculations of CNR and mean QSM values. Dotted lines in (C) and (F) indicate the edge of the brain before calculating QSM. Abbreviations: AC, anterior commissure. CdH, head of caudate nucleus. GPe, globus pallidus external segment. IC, internal capsule. Put, putamen. VP, ventral pallidum.
Fig. 3.
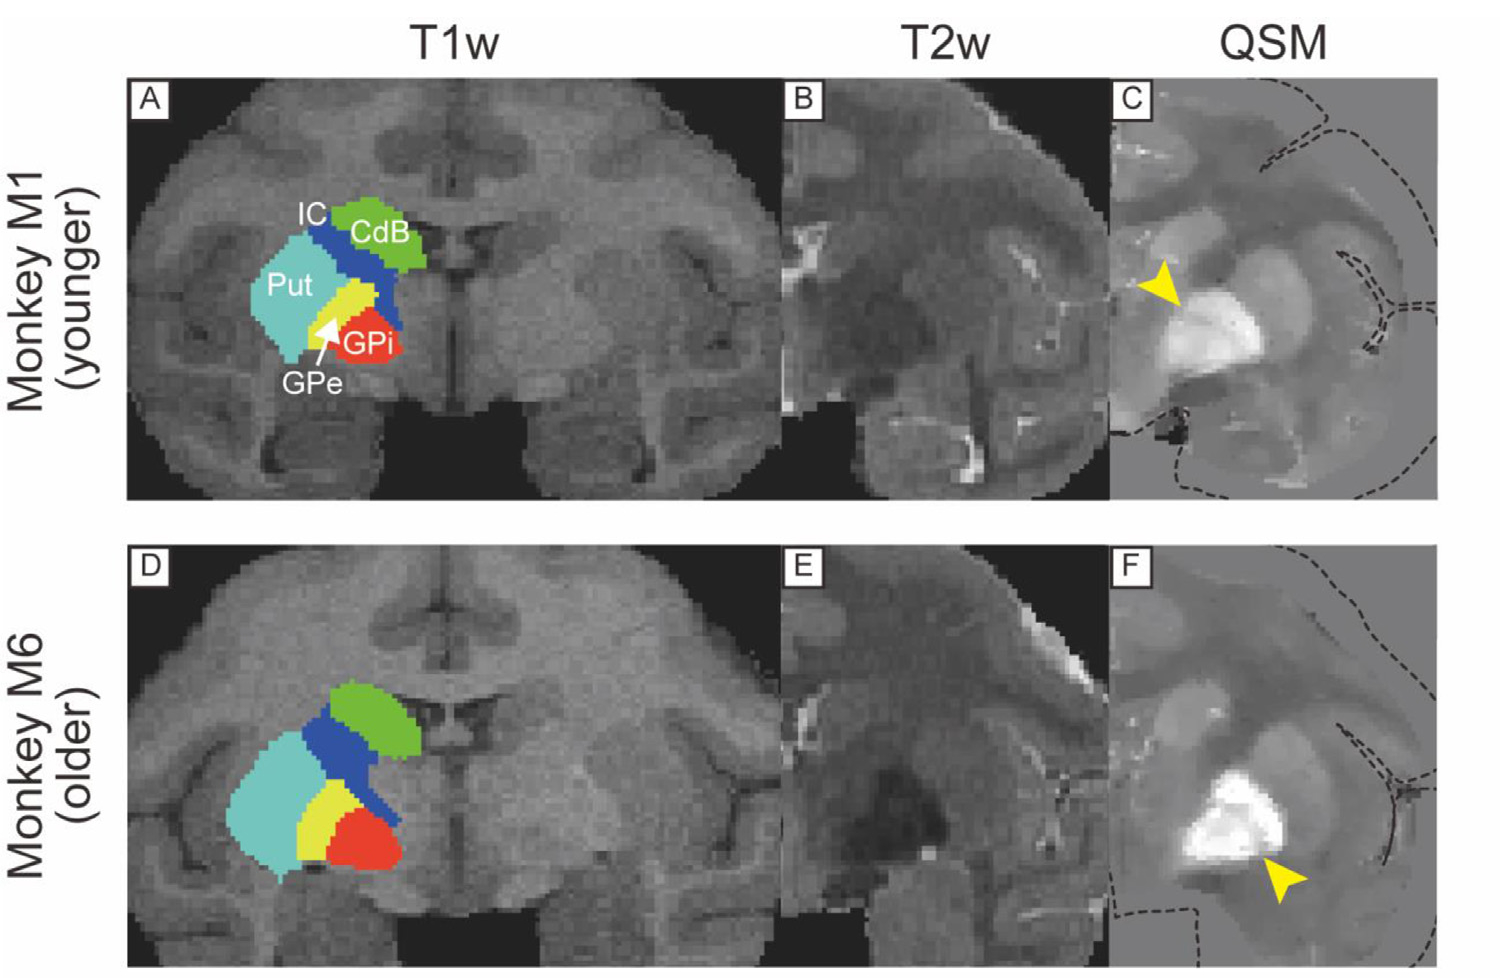
T1w, T2w, and QSM coronal images including borders of GPe and GPi in a younger (A, B, C) and older monkeys (D, E, F). Yellow arrowhead in (C) and (F) indicates the medial medullary lamina. Dotted lines in (C) and (F) indicate the edge of the brain. Abbreviations: CdB, body of caudate nucleus. GPe, globus pallidus external segment. GPi, globus pallidus internal segment. IC, internal capsule. Put, putamen.
Fig. 4.
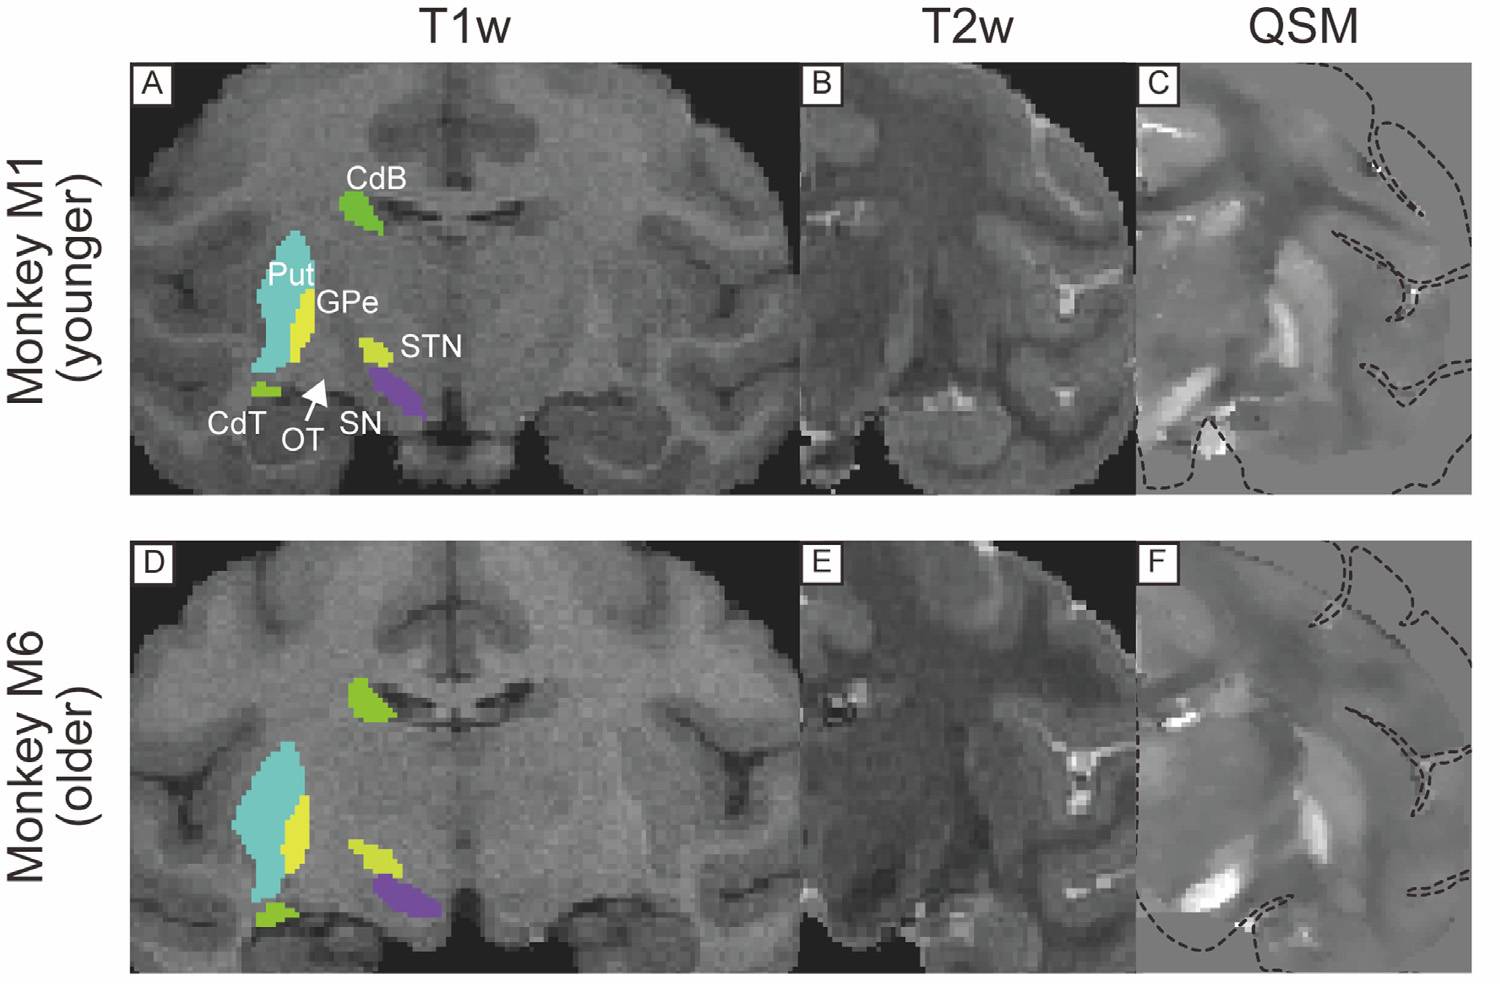
T1w, T2w, and QSM coronal images including substantia nigra in a younger (A, B, C) and older monkeys (D, E, F). Dotted lines in (C) and (F) indicate the edge of the brain. Abbreviations: CdB, body of caudate nucleus. CdT, tail of caudate nucleus. GPe, globus pallidus external segment. OT, optic tract. Put, putamen. SN, substantia nigra. STN, subthalamic nucleus.
Fig. 5.
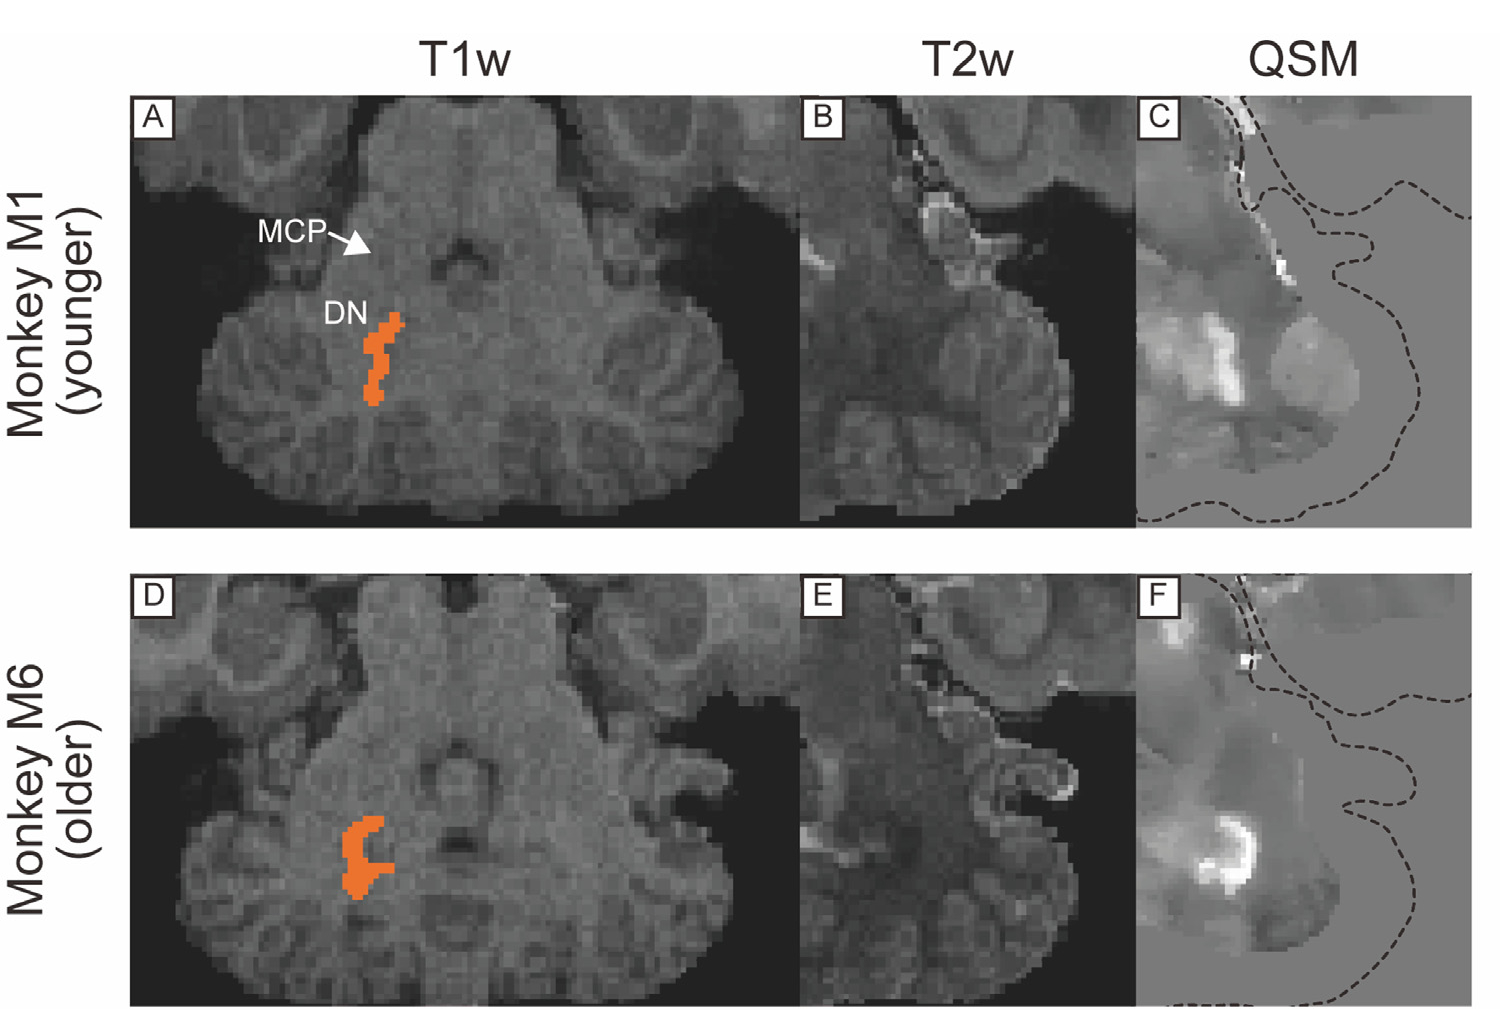
T1w, T2w, and QSM transverse images including dentate nucleus in cerebellum in a younger (A, B, C) and older monkeys (D, E, F). Dotted lines in (C) and (F) indicate the edge of the brain. Abbreviations: DN, dentate nucleus. MCP, middle cerebellar peduncle.
2.5. Statistical analyses
Friedman tests were performed to test whether two factors (the MRI sequences T1w, T2w, and QSM) and the generations (younger and older) have an effect on the CNRs of the subcortical structures (VP, GPe, GPi, SN, STN, and DN), followed by the post hoc multiple comparisons (Nemenyi test, P < 0.05). To investigate whether the QSM values in each subcortical structure were correlated with monkeys’ age, we also applied Spearman’s rank correlation test between monkeys’ age and the mean QSM values in each ROIs.
For multiple comparisons, we applied the Benjamini-Hochberg procedure to decrease the false discovery rate (Benjamini and Hochberg, 1995). We calculated six p-values for six subcortical structures (PVP, PGPe, PGPi, PSN, PSTN, and PDN) and assigned ranks to these p-values in the ascending order (rank 1 = P1, rank 6 = P6). Benjamini-Hochberg criteria of p-values were calculated by using the formula: (i/m) * Q, where i is the individual rank of p-value, m is the total number of tests (six in this study), and Q is the false discovery rate (set to 5%). Then, the critical value for the p-value of each rank is calculated as (1/6) * 0.05, (2/6) * 0.05, (3/6) * 0.05, (4/6) * 0.05, (5/6) * 0.05, and (6/6) * 0.05. After determining the largest p-value that was less than the criteria value, all smaller p-values (i.e. of lower rank) were deemed significant. The statistical analyses were performed using MATLAB Statistics and Machine Learning Toolbox (Math-works Inc., USA), and statistical software R (version 3.6.3) and its package PMCMRplus (version 1.9.0, Thorsten Pohlert: https://cran.r-project.org/web/packages/PMCMRplus/PMCMRplus.pdf).
3. Results
3.1. Visualization of subcortical structures
Figs. 2, 3, 4, and 5 show comparisons of subcortical structures among T1w, T2w, and QSM for several subcortical regions of the brain marked by low contrast in conventional anatomical MRI scans. The upper panel in each figure shows MR images from one of the younger monkeys (monkey M1, 8 y/o), while the lower panel illustrates images from one of the older monkeys (monkey M6, 14 y/o). In each case QSM highlighted certain substructures as having higher susceptibility, reflecting a higher level of iron content than neighboring areas. For example, QSM applied to the pallidal structure (Fig. 2C) showed distinct boundaries among the VP, GPe, and AC, in contrast to the conventional images where the boundaries were indistinct because all structures have similar T1w and T2w values. Fig. 3 illustrates the value of QSM in identifying the boundary of another portion of the globus pallidus, namely the medial medullary lamina between the GPe and GPi (indicated by yellow-colored arrowhead in Fig. 3C and F), also subtle or absent in T1w and T2w scans. In Fig. 4, the QSM further highlights the substantial nigra (SN) of the midbrain, and the nearby GPe components of the globus pallidus. Although the SN was detectable in QSM in both younger and older monkeys, the subthalamic nucleus (STN) was subtle even in QSM from the older monkey (Fig. 4F). QSM also revealed the position and detailed shape of the dentate nucleus in the cerebellum (Fig. 5), which was nearly invisible in T1w and T2w images. This marked difference probably stems from the elevated iron deposition in the dentate nucleus compared to other cerebellar nuclei, such as the less hyperintense nucleus interpositus and nucleus medialis.
3.2. Quantitative results
To quantitatively evaluate visualization of iron-rich subcortical structures in QSM, T1w, and T2w, we measured the CNRs of all targeted structures in each MR image and performed statistical tests.
Fig. 6 presents the results of comparing the CNRs. We found significant differences in CNRs only among image methods, but not between generations, using the Friedman test corrected by Benjamini-Hochberg procedure. Subsequent post hoc Nemenyi test revealed that the CNRs of targeted subcortical structures were significantly higher for the GPe, GPi, SN, STN, DN in QSM than in T1w, and higher for VP and SN in T2w (P < 0.05).
Fig. 6.
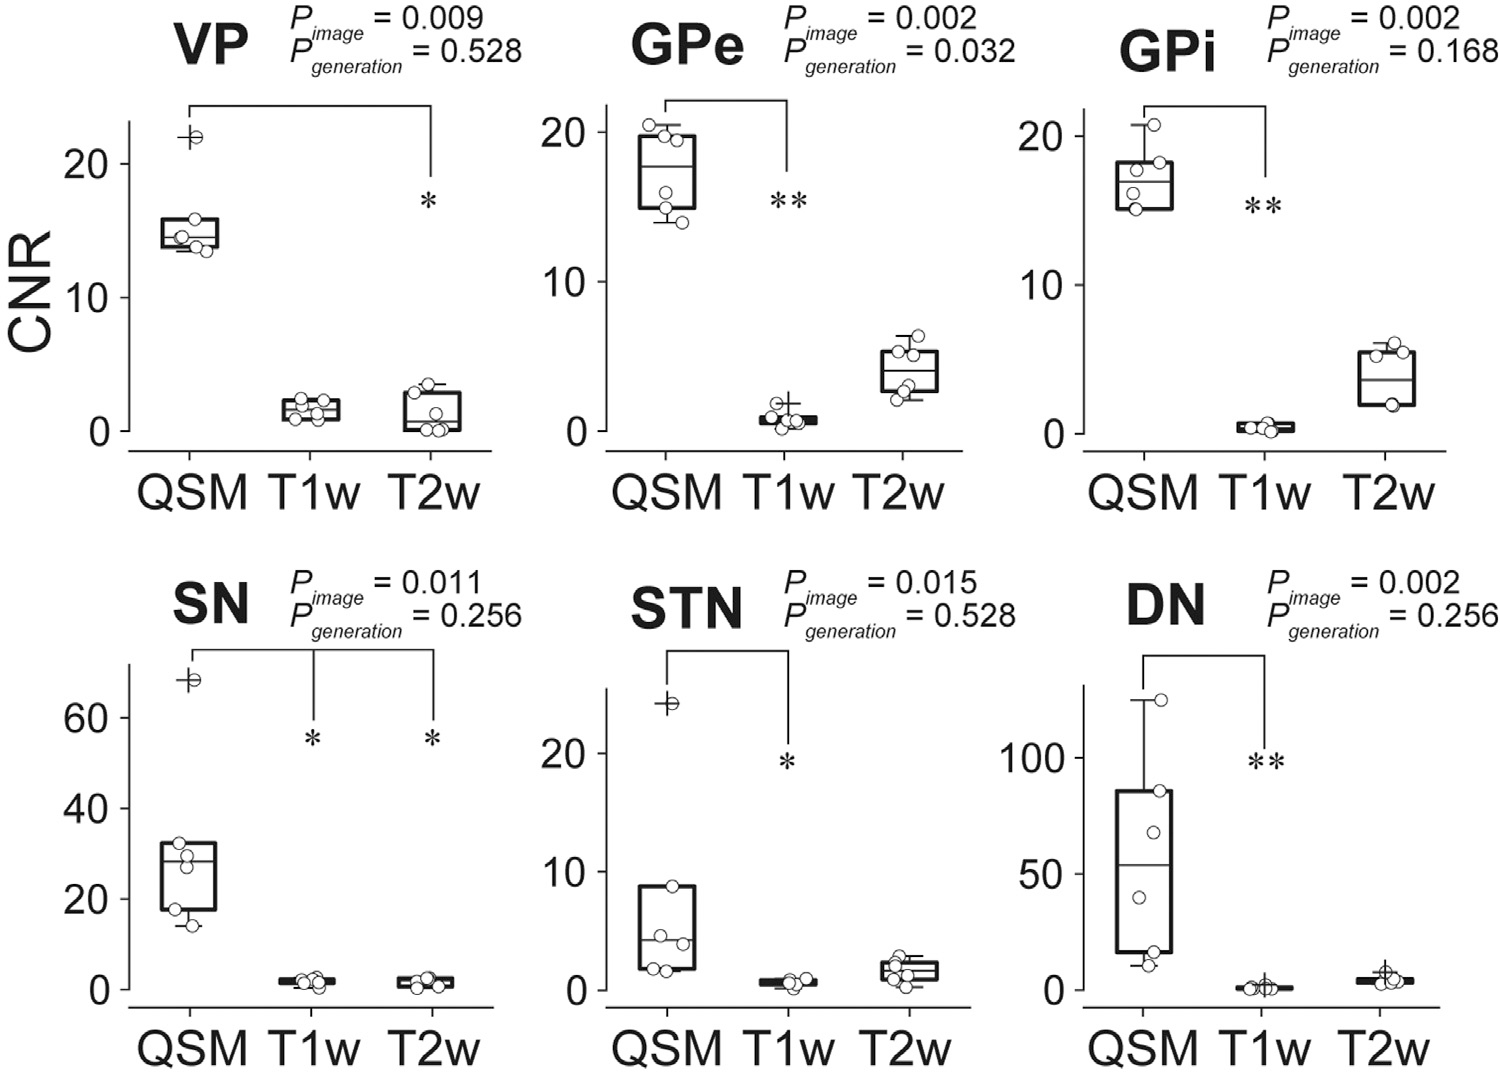
Comparison of CNR among subcortical regions in T1w, T2w, and QSM. In the box plots, upper and lower lines indicate the 75th and 25th percentile respectively, and middle lines show the median. Whiskers above and below the box represent the 10th and 90th percentiles. The cross sign indicates the outliers and the circle the CNR value of each data. Differences of CNR among images or between younger and older generation were assessed using Friedman test and post hoc test (Neminyi test) (* P < 0.05, ** P < 0.01). Abbreviations: DN, dentate nucleus. GPe, globus pallidus external segment. GPi, globus pallidus internal segment. SN, substantia nigra. STN, subthalamic nucleus. VP, ventral pallidum.
We also applied a regression analysis (Pearson’s rank correlation test) to investigate whether the mean QSM value of each ROI positively correlated with subject’s age (Fig. 7). The QSM values of the VP, GPe, GPi were significantly correlated with age (P < 0.05).
Fig. 7.
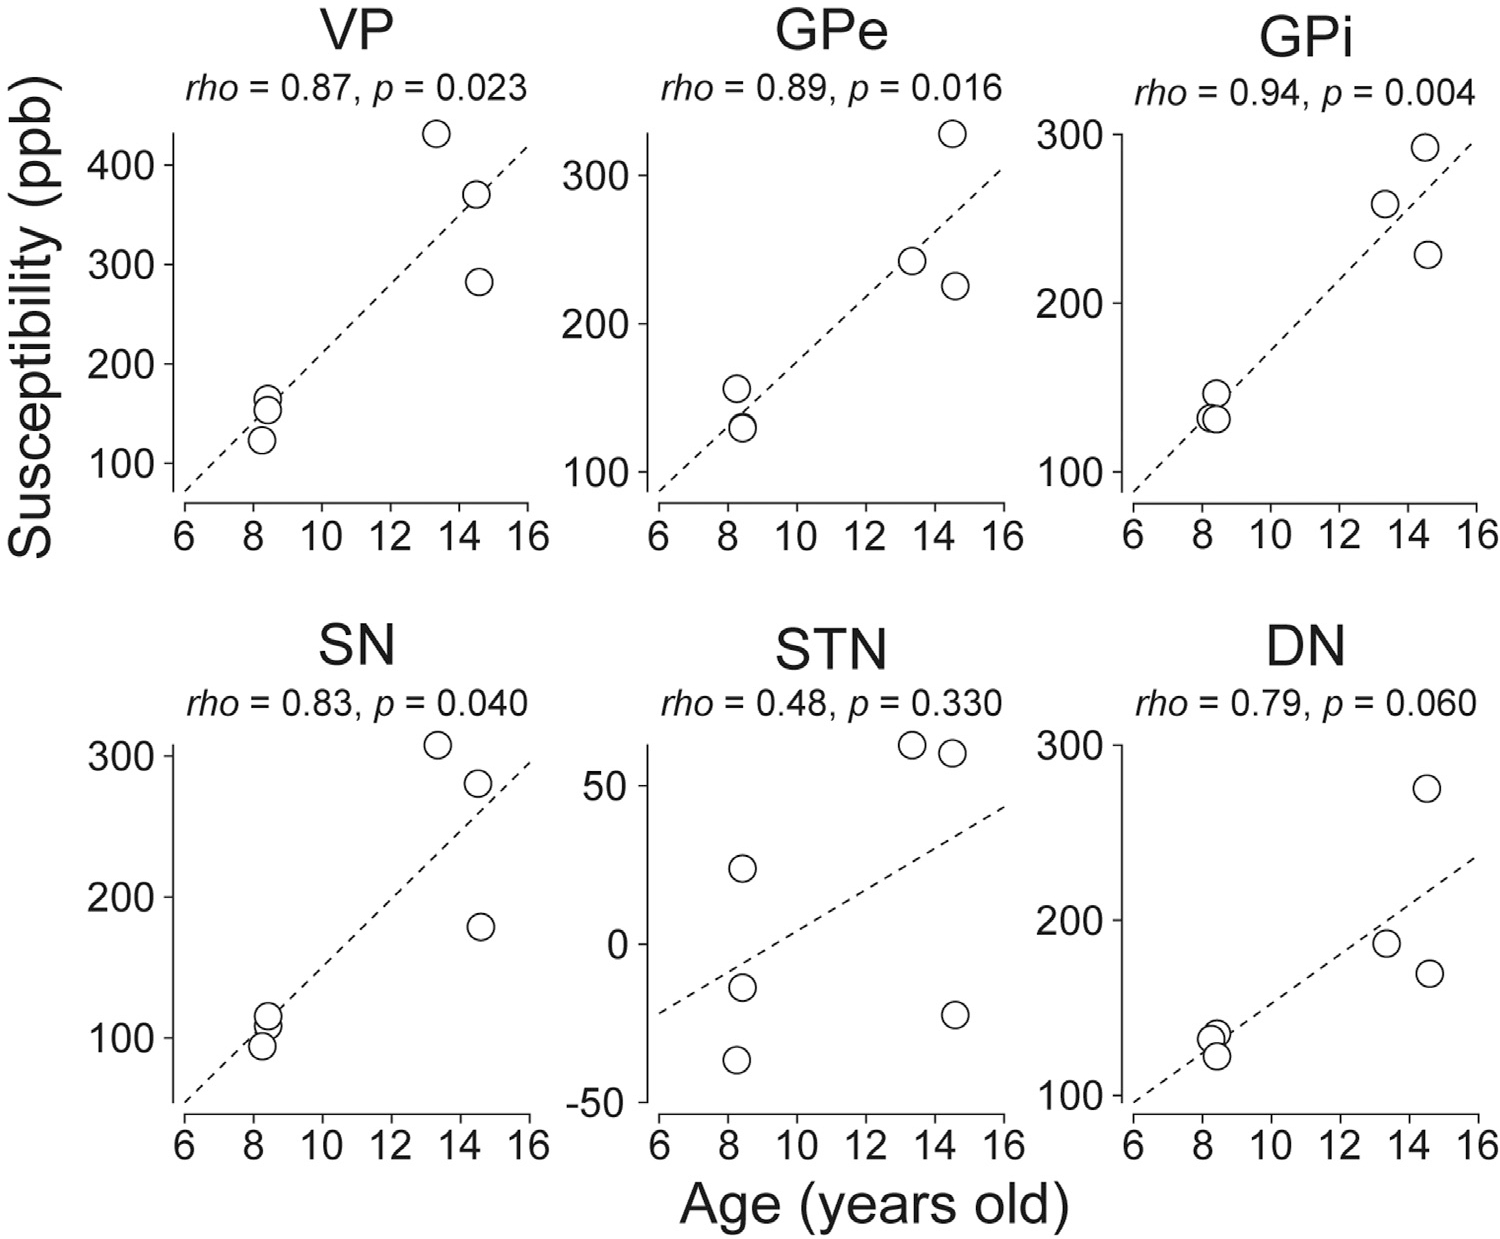
Correlation between monkeys’ ages and mean QSM values of subcortical areas. Each circle indicates the mean QSM value of individual subcortical ROIs and the dash line represents regression slope. Abbreviations: DN, dentate nucleus. GPe, globus pallidus external segment. GPi, globus pallidus internal segment. SN, substantia nigra. STN, subthalamic nucleus. VP, ventral pallidum. ppb, parts per billion.
4. Discussion
Our results indicate that quantitative susceptibility mapping in the macaque offers a marked improvement in the visualization of certain iron-rich subcortical structures, significantly heightening the CNRs over T1w and/or T2w images. Most notably, QSM enabled a clear and efficient differentiation of the VP, GPe, and GPi, SN, and DN from the white matter surrounding these structures. Thus, this anatomical scanning approach may be advantageous for neuroscientists targeting these and nearby structures for the recording of neuronal activity or the injection of viral vectors or other agents. To our knowledge, this is the first study of the feasibility of QSM in the macaque brain in vivo at 3T MRI, with only one previous article applying QSM to the macaque brain at 9.4T (Wen et al., 2019).
QSM is based on the local measurement of magnetic susceptibility tissue, which strongly reflects the concentration of paramagnetic unpaired electrons. This sensitivity makes QSM able to identify and delineate the boundaries of the structures prone to iron deposition as ferritin, such as the nuclei in the basal ganglia (the VP, GPe, GPi, and SN) and the cerebellum (DN) (Schweser et al., 2011; Schafer et al., 2012). Iron deposition in these structures occurs from a young age in humans (Bilgic et al., 2012; Keuken et al., 2017; Li et al., 2014; Persson et al., 2015) and probably also in macaque monkeys. Indeed, our study showed that QSM visualized these iron-rich structures even in younger monkeys around 8 years old.
The improved CNRs of the iron-rich subcortical structures compared to T1w and T2w, QSM allows macaque researchers to investigate these subcortical regions in a way that has not previously been possible using anatomical MRI methods. Clear visualization of the structures in QSM can increase the efficiency of researchers by decreasing the number of electrode or needle penetrations required for successful targeting of the regions under investigation. Several human neurosurgery researchers have recently reported that QSM is useful for surgical implantation of electrodes for deep brain stimulation (DBS) in patients with Parkinson’s disease or dystonia. In agreement with the work shown here, these studies showed that QSM at field strengths of 3T (Dimov et al., 2018; Li et al., 2020; Wei et al., 2019) and 7T (de Hollander et al., 2014) were sufficient for visualizing subcortical DBS targets (the STN, GPi, and centromedian thalamic nucleus).
One possible use of this method would be to include QSM contrast in new macaque MRI brain atlases such as the National Institute of Mental Health Macaque Template (NMT), which is a high-quality contrast based on T1w images of 31 macaque monkeys (Jung et al., 2021; Seidlitz et al., 2018). Although the location of basal ganglia subregions are shown in the NMT, the T1w images, particularly in younger monkeys, do not provide sufficient contrast to segment the substantia nigra (SN). This lack of T1w contrast limits precise alignment between the standard template and the native structure image. Indeed, we found that automated alignment of the SN region in the SARM atlas to the native subject’s T1w images resulted in a systematic bias of ROIs in the superior direction (Fig. S1), which necessitated manual correction of SN ROIs for all subjects. Using QSM imaging for registration to NMT and SARM will improve localization of iron rich nuclei, and aid MRI research into subcortical brain regions.
Finally, there are a few limitations of this method that should be noted. First, QSM is highly sensitive to tissue with substances that induce susceptibility change. After penetration of electrodes or needles, hemosiderin deposit will happen naturally in the affected brain tissue. Because hemosiderin includes iron, QSM detects hemosiderin deposit as hyperintensity. Thus, it may not be easy to see the accurate borders of the subcortical structures in QSM after several electrode or needle penetrations. Therefore, it may be ideal to carry out QSM scanning before any penetrations or early in the experiment. Second, because iron deposition in the subcortical structures starts during adolescence in humans, the QSM method does not show hyperintensity in these structures in childhood (Bilgic et al., 2012; Li et al., 2014; Persson et al., 2015). We did not test whether QSM can visualize iron-rich structures in infant monkeys. One previous paper showed iron accumulation on the GP of macaque monkeys as young as one and two years old, as revealed by Perl’s stain (Bizzi et al., 1990), which suggests that QSM might be advantageous in young monkeys. Third, we used the human knee coil and a loop surface coil would have been enough to image some smaller subjects in the group and would have provided high SNR. However, to be useful in most experiment subjects, the knee coil, which is available in many clinical scanners, is practically a feasible choice. Our results were obtained with the same knee coil for all subjects, to avoid any coil influence on the comparison. As Fig. 2 and 3 showed, the T2w images at 3T can be used to visualize the iron-rich structures such as the GPe and GPi in older subjects, but it might be less useful in younger subjects. The QSM performed at similar conditions had a much-improved contrast for those structures in younger subjects; thus, the QSM may be useful if T1w and T2w can’t visualize the iron-rich structures well.
Conclusion
Our results suggest that QSM visualized the subcortical structures more clearly than the conventional T1w and T2w. It may be useful for a range of neuroscience applications in NHP that benefit from the clear visualization of structural divisions among subcortical regions.
Supplementary Material
Acknowledgments
This research was supported by the Intramural Research Program of the National Eye Institute (ZIA EY000415) and National Institute of Mental Health (ZIC MH002899), as well as a JSPS KAKENHI Grant (Grant-in-Aid for Fostering Joint International Research (A), 17KK0180). MRI scanning was carried out in the Neurophysiology Imaging Facility Core (National Institute of Mental Health, National Institute of Neurological Disorders and Stroke, and National Eye Institute). We thank D. McMahon for manuscript-writing assistance. We also thank D. Parker, A. Lopez, D. O’Brien, V.L. McLean, I. Bunea, G. Tansey, M.K. Smith, A.M. Nichols, D. Yochelson, J.W. McClurkin, A.V. Hays, and J. Fuller-Deets for technical assistance.
Abbreviation:
- AC
anterior commissure
- CNR
contrast-to-noise ratio
- CdB
body of caudate nucleus
- CdH
head of caudate nucleus
- CdT
tail of caudate nucleus
- DBS
deep brain stimulation
- DN
dentate nucleus
- GPe
globus pallidus external segment
- GPi
globus pallidus internal segment
- IC
internal capsule
- GRE
gradient echo
- MCP
middle cerebellar peduncle
- MPRAGE
magnetization prepared rapid gradient echo
- MRI
magnetic resonance imaging
- NHP
non-human primate
- NMT
NIMH macaque template
- OT
optic tract
- ppb
parts per billion
- Put
putamen
- QSM
quantitative susceptibility mapping
- ROI
region of interest
- SARM
subcortical atlas of the rhesus macaque
- SN
substantia nigra
- SNR
signal-to-noise ratio
- SPACE
sampling perfection with application optimized contrasts using different flip angle evolution
- STN
subthalamic nucleus
- T1w
T1-weighted
- T2w
T2-weighted
- TE
echo time
- TR
repetition time
- 3D
three-dimensional
- VP
ventral pallidum
Footnotes
Declaration of Competing Interest
All authors claim that there are no conflicts of interest.
Credit authorship contribution statement
Atsushi Yoshida: Conceptualization, Methodology, Investigation, Software, Formal analysis, Writing – original draft, Visualization, Funding acquisition. Frank Q. Ye: Conceptualization, Methodology, Investigation, Writing – review & editing. David K. Yu: Conceptualization, Methodology, Investigation, Writing – review & editing. David A. Leopold: Conceptualization, Methodology, Writing – review & editing, Supervision, Funding acquisition. Okihide Hikosaka: Conceptualization, Methodology, Writing – review & editing, Supervision, Funding acquisition.
Supplementary materials
Supplementary material associated with this article can be found, in the online version, at doi:10.1016/j.neuroimage.2021.118429.
Data availability
MR images data related to this publication will be made available upon reasonable request to the corresponding author, after clearance from the Institutional Review Board.
References
- Amita H, Kim HF, Inoue KI, Takada M, Hikosaka O, 2020. Optogenetic manipulation of a value-coding pathway from the primate caudate tail facilitates saccadic gaze shift. Nat. Commun. 11, 1876. [DOI] [PMC free article] [PubMed] [Google Scholar]
- Autio JA, Glasser MF, Ose T, Donahue CJ, Bastiani M, Ohni M, Kawabata Y, Urushibata Y, Murata K, Nishigori K, Yamaguchi M, Hori Y, Yoshida A, Go Y, Coalson TS, Jbabdi S, Sotiropoulos SN, Kennedy H, Smith S, Van Essen DC, Hayashi T, 2020. Towards HCP-Style macaque connectomes: 24-Channel 3T multi--array coil, MRI sequences and preprocessing. Neuroimage 215, 11680. [DOI] [PMC free article] [PubMed] [Google Scholar]
- Benjamini Y, Hochberg Y, 1995. Controlling the false discovery rate: a practical and powerful approach to multiple testing. J. R. Statist. Soc. B. 57, 289–300. [Google Scholar]
- Bizzi A, Brooks RA, Brunetti A, Hill JM, Alger JR, Miletich RS, Francavilla TL, Di Chiro G, 1990. Role of iron and ferritin in MR imaging of the brain: a study in primates at different field strengths. Radiology 177, 59–65. [DOI] [PubMed] [Google Scholar]
- Bollmann S, Rasmussen KGB, Kristensen M, Blendal RG, Østergaard LR, Plocharski M, O’Brien K, Langkammer C, Janke A, Barth M, 2019. DeepQSM - using deep learning to solve the dipole inversion for quantitative susceptibility mapping. Neuroimage 195, 373–383. [DOI] [PubMed] [Google Scholar]
- Bonaventura J, Eldridge MAG, Hu F, Gomez JL, Sanchez-Soto M, Abramyan AM, Lam S, Boehm MA, Ruiz C, Farrell MR, Moreno A, Galal Faress IM, Andersen N, Lin JY, Moaddel R, Morris PJ, Shi L, Sibley DR, Mahler SV, Nabavi S, Pomper MG, Bonci A, Horti AG, Richmond BJ, Michaelides M, 2019. High-potency ligands for DREADD imaging and activation in rodents and monkeys. Nat. Commun. 10, 4627. [DOI] [PMC free article] [PubMed] [Google Scholar]
- Bilgic B, Pfefferbaum A, Rohlfing T, Sullivan EV, Adalsteinsson E, 2012. MRI estimates of brain iron concentration in normal aging using quantitative susceptibility mapping. Neuroimage 59, 2625–2635. [DOI] [PMC free article] [PubMed] [Google Scholar]
- Cox RW, 1996. AFNI: software for analysis and visualization of functional magnetic resonance neuroimages. Compt. Biomed. Res. 29, 162–173. [DOI] [PubMed] [Google Scholar]
- Dimov AV, Gupta A, Kopell BH, Wang Y, 2018. High-resolution QSM for functional and structural depiction of subthalamic nuclei in DBS presurgical mapping. J. Neurosurg. 131, 360–367. [DOI] [PubMed] [Google Scholar]
- de Hollander G, Keuken MC, Bazin PL, Weiss M, Neumann J, Reimann K, Wähnert M, Turner R, Forstmann BU, Schäfer A, 2014. A gradual increase of iron toward the medial-inferior tip of the subthalamic nucleus. Hum. Brain Mapp. 35, 4440–4449. [DOI] [PMC free article] [PubMed] [Google Scholar]
- El-Shamayleh Y, Horwitz GD, 2019. Primate optogenetics: progress and prognosis. Proc. Natl. Acad. Sci. U. S. A. 116, 26195–26203. [DOI] [PMC free article] [PubMed] [Google Scholar]
- Eldridge MA, Lerchner W, Saunders RC, Kaneko H, Krausz KW, Gonzalez FJ, Ji B, Higuchi M, Minamimoto T, Richmond BJ, 2016. Chemogenetic disconnection of monkey orbitofrontal and rhinal cortex reversibly disrupts reward value. Nat. Neurosci. 19, 37–39. [DOI] [PMC free article] [PubMed] [Google Scholar]
- Fredericks JM, Dash KE, Jaskot EM, Bennett TW, Lerchner W, Dold G, Ide D, Cummins AC, Der Minassian VH, Turchi JN, Richmond BJ, Eldridge MAG, 2020. Methods for mechanical delivery of viral vectors into rhesus monkey brain. J. Neurosci. Methods 339, 108730. [DOI] [PMC free article] [PubMed] [Google Scholar]
- Hartig R, Glen D, Jung B, Logothethis NK, Paxinos G, Garza-Villarreal EA, Messinger A, Evrard HC, 2021. The subcortical atlas of the rhesus macaque (SARM) for neuroimaging. Neuroimage, 117996. [DOI] [PubMed] [Google Scholar]
- Jung B, Taylor P, Seidlitz J, Sponheim C, Perkins P, Ungerleider LG, Glen D, Messinger A, 2021. A comprehensive macaque fMRI pipeline and hierarchical atlas. Neuroimage, 117997. [DOI] [PMC free article] [PubMed] [Google Scholar]
- Kueken MC, Bazin P-L, Backhouse K, Beekhuizen S, Himmer L, Kandola A, Lafeber JJ, Prochazkova L, Trutti A, Schafer A, Turner R, Forstmann BU, 2017. Effects of aging on T1, T2*, and QSM MRI values in the subcortex. Brain Struct. Funct. 222, 2487–2505. [DOI] [PMC free article] [PubMed] [Google Scholar]
- Li J, Li Y, Gutierrez L, Xu W, Wu Y, Liu C, Li D, Sun B, Zhang C, Wei H, 2020. Imaging the centromedian thalamic nucleus using quantitative susceptibility mapping. Front. Hum. Neurosci. 13, 447. [DOI] [PMC free article] [PubMed] [Google Scholar]
- Li W, Wu B, Liu C, 2011. Quantitative susceptibility mapping of human brain reflects spatial variation in tissue composition. Neuroimage 55, 1645–1656. [DOI] [PMC free article] [PubMed] [Google Scholar]
- Li W, Wu B, Batrachenko A, Bancroft-Wu V, Morey RA, Shashi V, Langkammer C, De Bellis MD, Ropele S, Song AW, Liu C, 2014. Differential developmental trajectories of magnetic susceptibility in human brain gray and white matter over the lifespan. Hum. Brain Mapp. 35, 2698–2713. [DOI] [PMC free article] [PubMed] [Google Scholar]
- Liu C, Li W, Tong KA, Yeom KW, Kuzminski S, 2015. Susceptibility-weighted imaging and quantitative susceptibility mapping in the brain. J. Magn. Reson. Imaging 42, 23–41. [DOI] [PMC free article] [PubMed] [Google Scholar]
- Liu J, Liu T, de Rochefort L, Ledoux J, Khalidov I, Chen W, Tsiouris AJ, Wisnieff C, Spincemaille P, Prince MR, Wang Y, 2012. Morphology enabled dipole inversion for quantitative susceptibility mapping using structural consistency between the magnitude image and the susceptibility map. Neuroimage 59, 2560–2568. [DOI] [PMC free article] [PubMed] [Google Scholar]
- Liu T, Spincemaille P, de Rochefort L, Kressler B, Wang Y, 2009. Calculation of susceptibility through multiple orientation sampling (COSMOS): a method for conditioning the inverse problem from measured magnetic field map to susceptibility source image in MRI. Magn. Reson. Med. 61, 196–204. [DOI] [PubMed] [Google Scholar]
- Liu T, Liu J, de Rochefort L, Spincemaille P, Khalidov I, Ledoux JR, Wang Y, 2011. Morphology enabled dipole inversion (MEDI) from a single-angle acquisition: comparison with COSMOS in human brain imaging. Magn. Reson. Med. 66, 777–783. [DOI] [PubMed] [Google Scholar]
- Liu T, Wisnieff C, Lou M, Chen W, Spincemaille P, Wang Y, 2013a. Nonlinear formulation of the magnetic field to source relationship for robust quantitative susceptibility mapping. Magn. Reson. Med. 69, 467–476. [DOI] [PubMed] [Google Scholar]
- Liu T, Eskreis-Winkler S, Schweitzer AD, Chen W, Kaplitt MG, Tsiouris AJ, Wang Y, 2013b. Improved subthalamic nucleus depiction with quantitative susceptibility mapping. Radiology 269, 216–223. [DOI] [PMC free article] [PubMed] [Google Scholar]
- Liu Z, Spincemaille P, Yao Y, Zhang Y, Wang Y, 2018. MEDI+0: morphology enabled dipole inversion with automatic uniform cerebrospinal fluid zero reference for quantitative susceptibility mapping. Magn. Reson. Med. 79, 2795–2803. [DOI] [PMC free article] [PubMed] [Google Scholar]
- Maeda K, Inoue KI, Kunimatsu J, Takada M, Hikosaka O, 2020. Primate amygdalo-nigral pathway for boosting oculomotor action in motivating situations. iScience 23, 101194. [DOI] [PMC free article] [PubMed] [Google Scholar]
- Mugler JP 3rd, Bao S, Mulkern RV, Guttmann CR, Robertson RL, Jolesz FA, Brookeman JR, 2000. Optimized single-slab three-dimensional spin-echo MR imaging of the brain. Radiology 216, 891–899. [DOI] [PubMed] [Google Scholar]
- Nagai Y, Kikuchi E, Lerchner W, Inoue KI, Ji B, Eldridge MA, Kaneko H, Kimura Y, Oh-Nishi A, Hori Y, Kato Y, Hirabayashi T, Fujimoto A, Kumata K, Zhang MR, Aoki I, Suhara T, Higuchi M, Takada M, Richmond BJ, Minamimoto T, 2016. PET imaging-guided chemogenetic silencing reveals a critical role of primate rostromedial caudate in reward evaluation. Nat. Commun. 7, 13605. [DOI] [PMC free article] [PubMed] [Google Scholar]
- Persson N, Wu J, Zhang Q, Liu T, Shen J, Bao R, Ni M, Liu T, Wang Y, Spincemaille P, 2015. Age and sex related differences in subcortical brain iron concentrations among healthy adults. Neuroimage 122, 385–398. [DOI] [PMC free article] [PubMed] [Google Scholar]
- Schafer A, Forstmann BU, Neumann J, Wharton S, Mietke A, Bowtell R, Turner R, 2012. Direct visualization of the subthalamic nucleus and its iron distribution using high-resolusion susceptibility mapping. Hum. Brain Mapp. 33, 2831–2842. [DOI] [PMC free article] [PubMed] [Google Scholar]
- Schweser F, Deistung A, Lehr BW, Reichenbach JR, 2011. Quantitative imaging of intrinsic magnetic tissue properties using MRI signal phase: an approach to in vivo brain iron metabolism? Neuroimage 54, 2789–2807. [DOI] [PubMed] [Google Scholar]
- Seidlitz J, Sponheim C, Glen D, Ye FQ, Saleem KS, Leopold DA, Ungerleider L, Messinger A, 2018. A population MRI brain template and analysis tools for the macaque. Neuroimage 170, 121–131. [DOI] [PMC free article] [PubMed] [Google Scholar]
- Tang J, Liu S, Neelavalli J, Cheng YC, Buch S, Haacke EM, 2013. Improving susceptibility mapping using a threshold-based K-space/image domain iterative reconstruction approach. Magn. Reson. Med. 69, 1396–1407. [DOI] [PMC free article] [PubMed] [Google Scholar]
- Wang Y, Liu T, 2015. Quantitative susceptibility mapping (QSM): decoding MRI data for a tissue magnetic biomarker. Magn. Reson. Med. 73, 82–101. [DOI] [PMC free article] [PubMed] [Google Scholar]
- Wei H, Zhang C, Wang T, He N, Li D, Zhang Y, Liu C, Yan F, Sun B, 2019. Precise targeting of the globus pallidus internus with quantitative susceptibility mapping for deep brain stimulation surgery. J. Neurosurg, 191254. [DOI] [PubMed] [Google Scholar]
- Wen Q, Yang H, Zhong K, 2019. Quantitative susceptibility mapping of ultra-high resolution monkey brain in vivo at 9.4 T. Sheng Wu Yi Xue Gong Cheng Xue Za Zhi 36, 349–355. [DOI] [PMC free article] [PubMed] [Google Scholar]
- Wharton S, Schäfer A, Bowtell R, 2010. Susceptibility mapping in the human brain using threshold-based k-space division. Magn. Reson. Med. 63, 1292–1304. [DOI] [PubMed] [Google Scholar]
- Wu B, Li W, Guidon A, Liu C, 2012. Whole brain susceptibility mapping using compressed sensing. Magn. Reson. Med. 67, 137–147. [DOI] [PMC free article] [PubMed] [Google Scholar]
Associated Data
This section collects any data citations, data availability statements, or supplementary materials included in this article.
Supplementary Materials
Data Availability Statement
MR images data related to this publication will be made available upon reasonable request to the corresponding author, after clearance from the Institutional Review Board.


