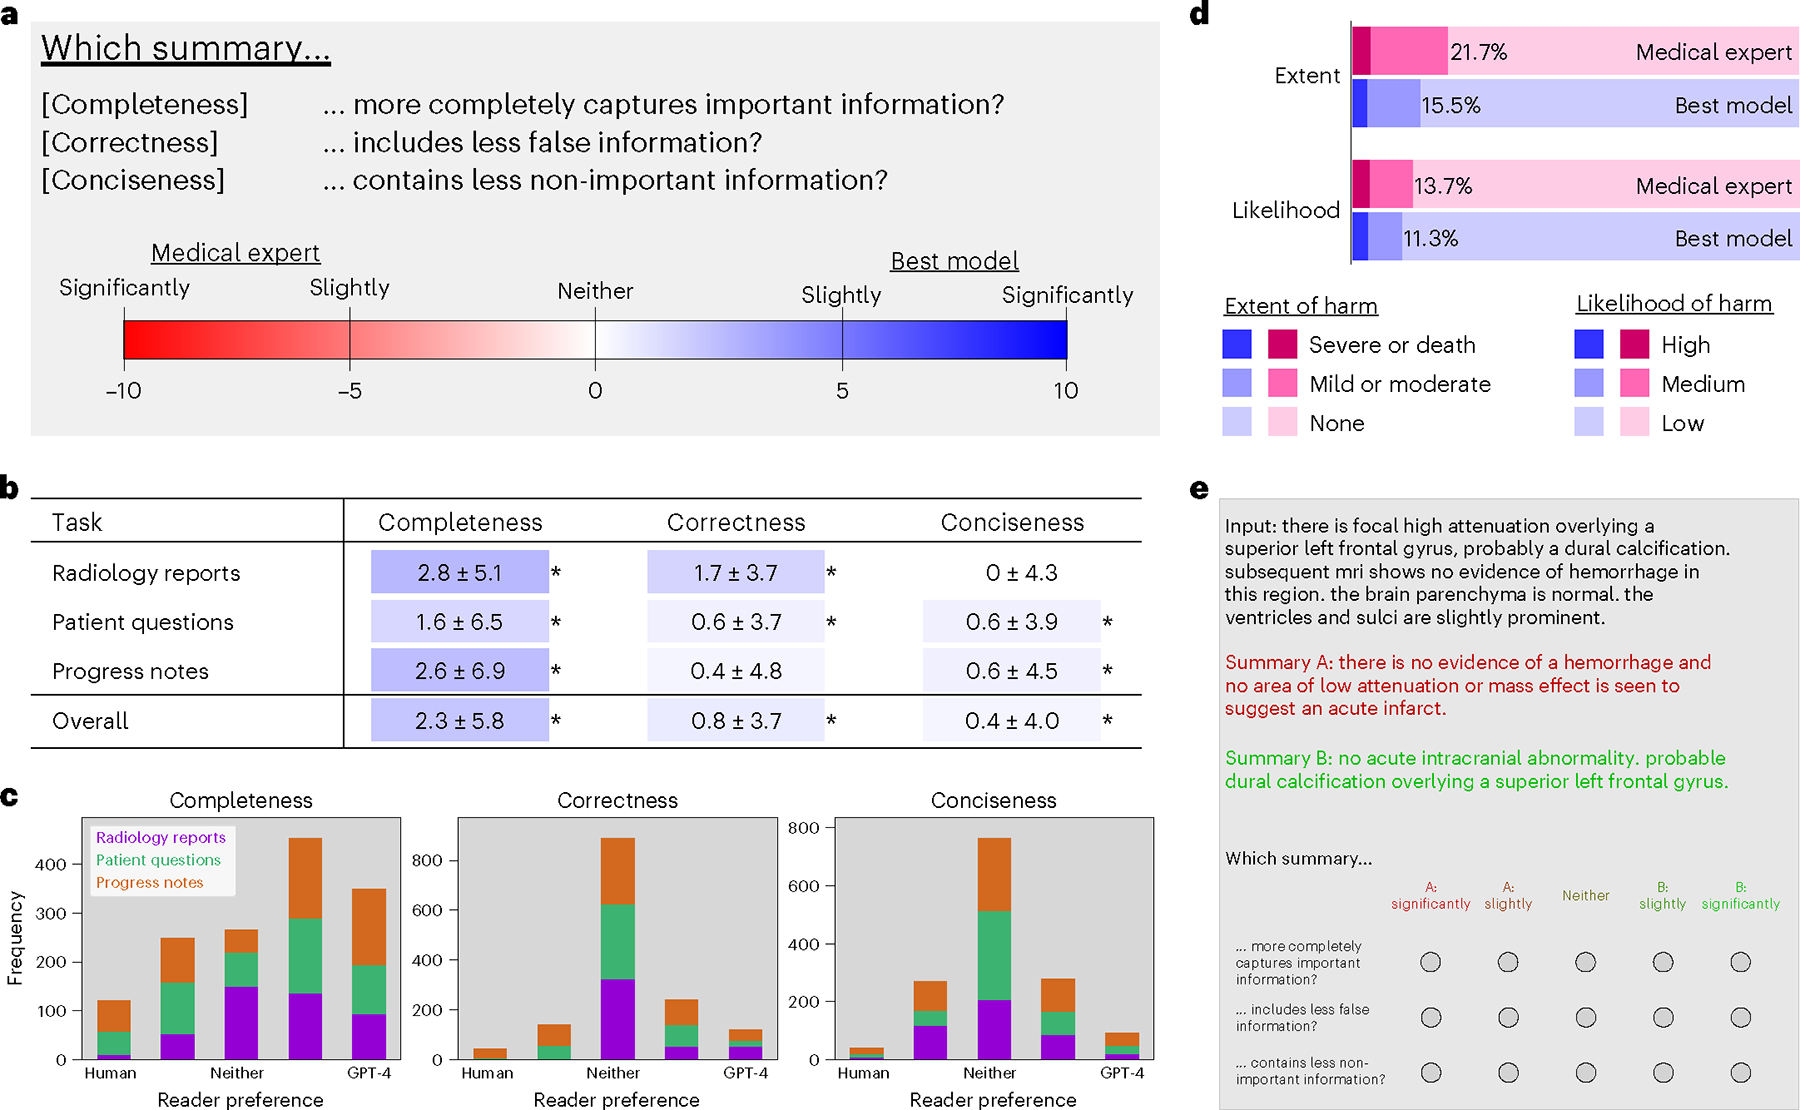
Fig. 4 |. Clinical reader study.

a, Study design comparing summaries from the best model versus that of medical experts on three attributes: completeness, correctness and conciseness. b, Results. Highlight colors correspond to a value’s location on the color spectrum. Asterisks (*) denote statistical significance by a one-sided Wilcoxon signed-rank test, P < 0.001. c, Distribution of reader scores for each summarization task across attributes. Horizontal axes denote reader preference as measured by a five-point Likert scale. Vertical axes denote frequency count, with 1,500 total cases for each plot. d, Extent and likelihood of possible harm caused by choosing summaries from the medical expert (pink) or best model (purple) over the other. e, Reader study user interface.
