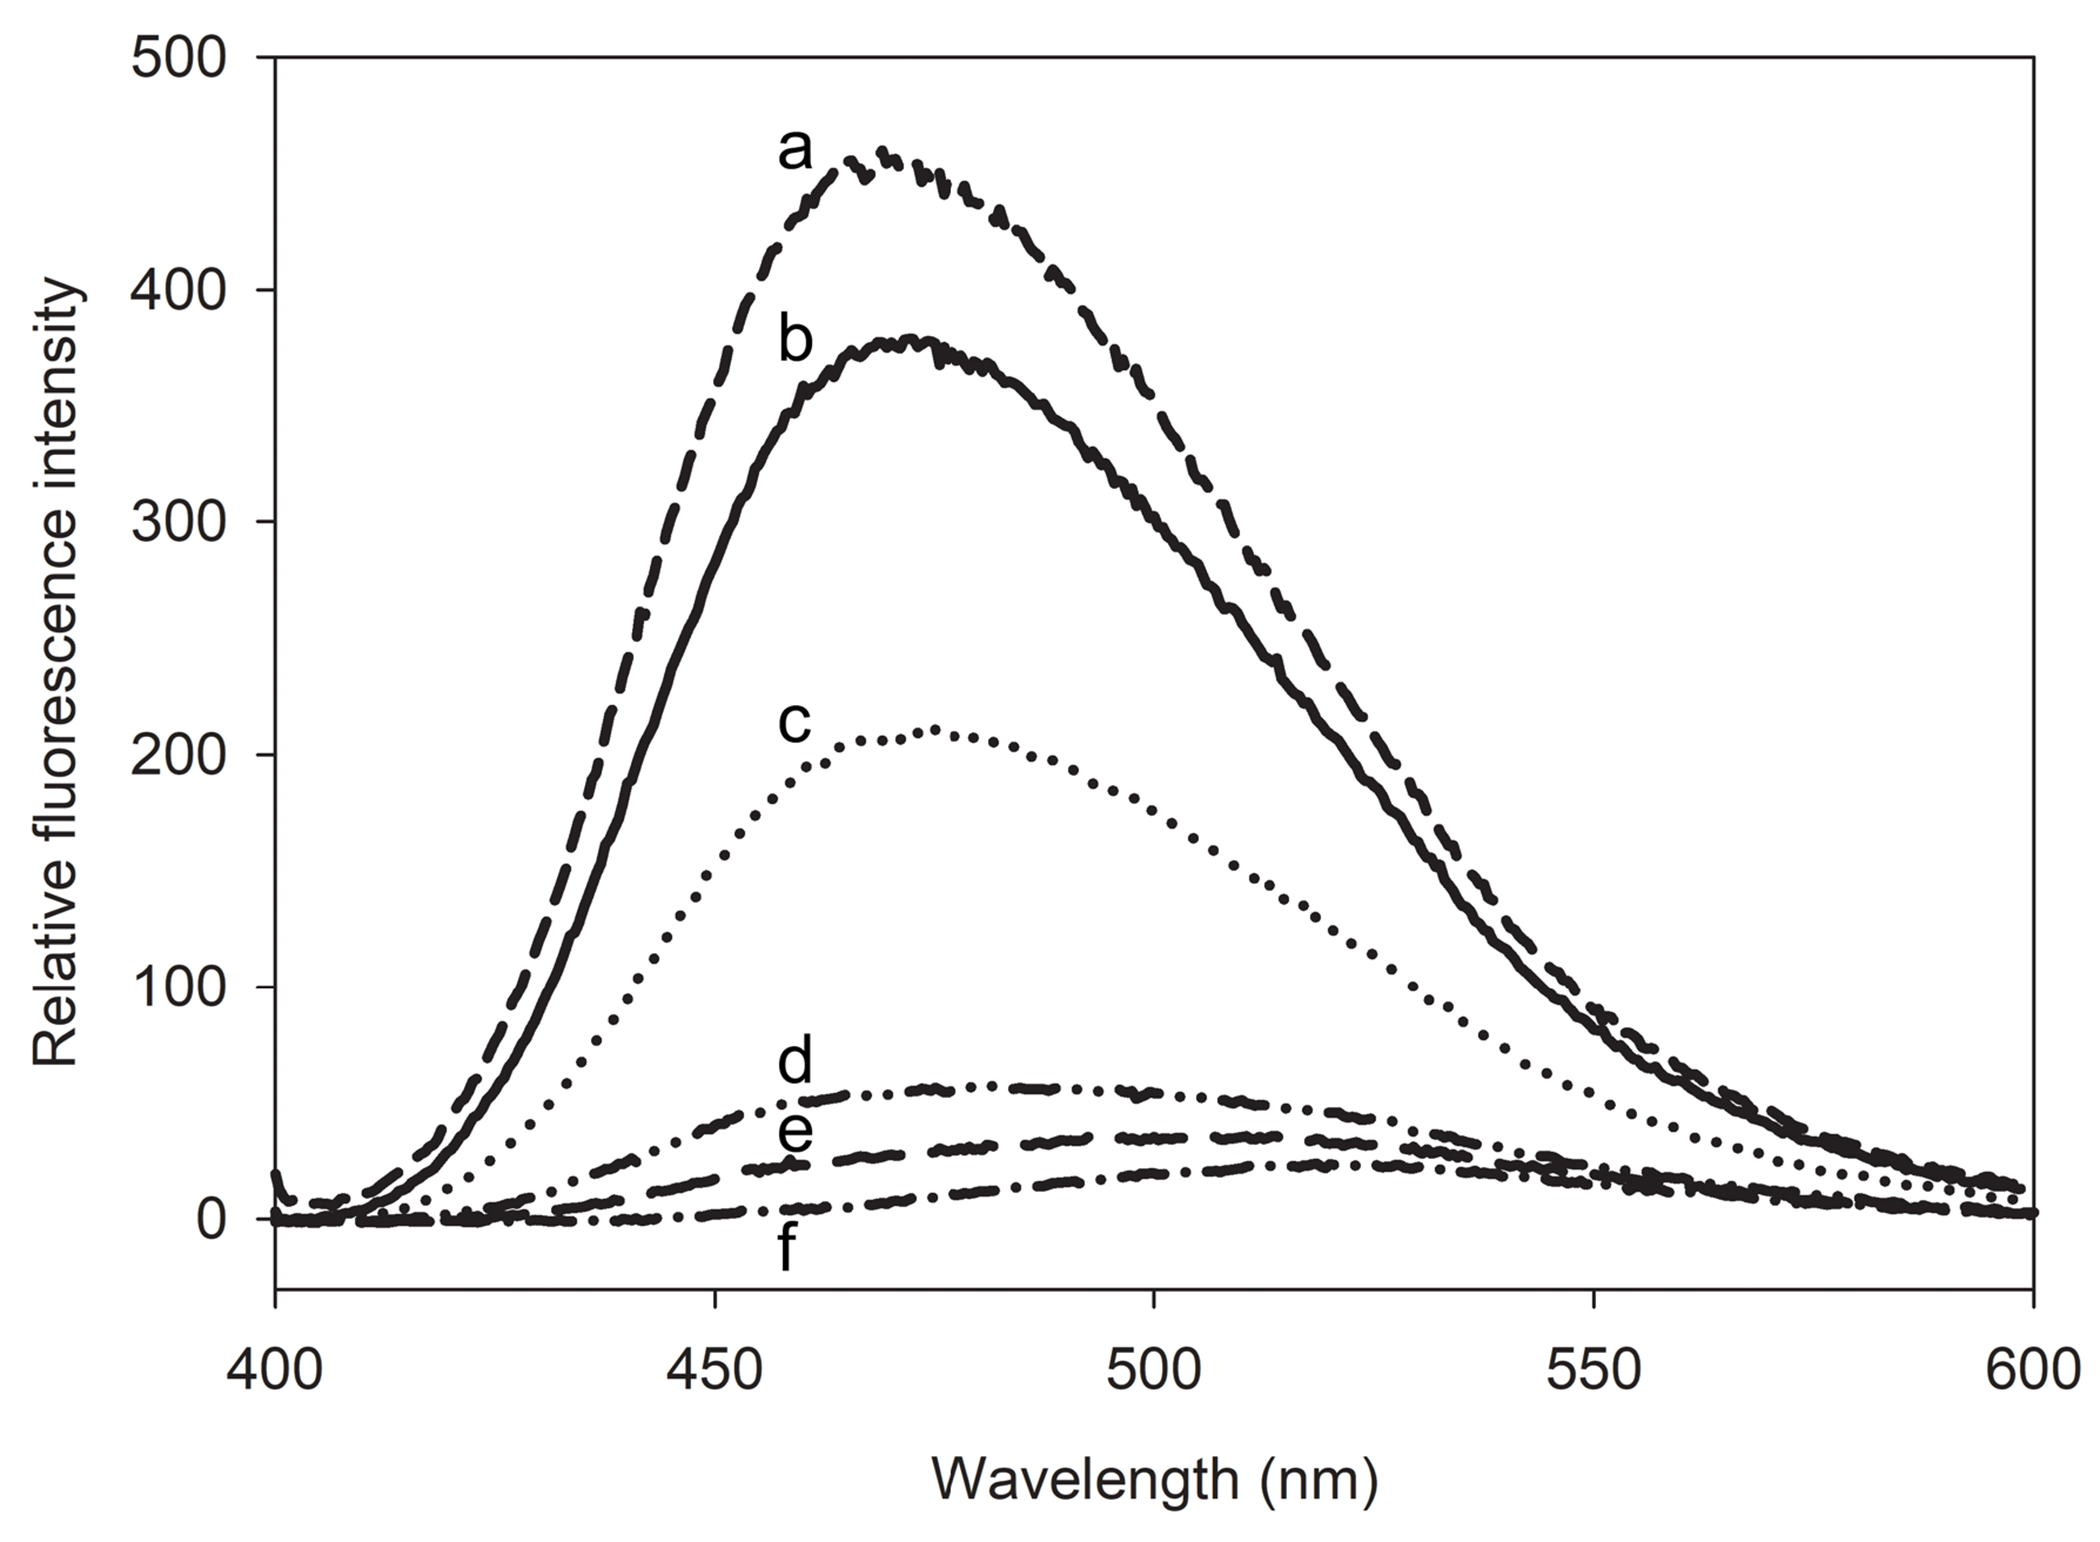
Figure 4.

ANS fluorescence emission spectra of apoLp-III/CT-apoE. Following excitation at 395 nm, the fluorescence emission spectra of 125 μM ANS were recorded in the presence of 2.5 μM apoE3 (a), apoLp-III/CT-apoE (b), CT-apoE (c), NT-apoE3 (d), and apoLp-III (e). The ANS fluorescence profile in the absence of protein is shown in plot f.
