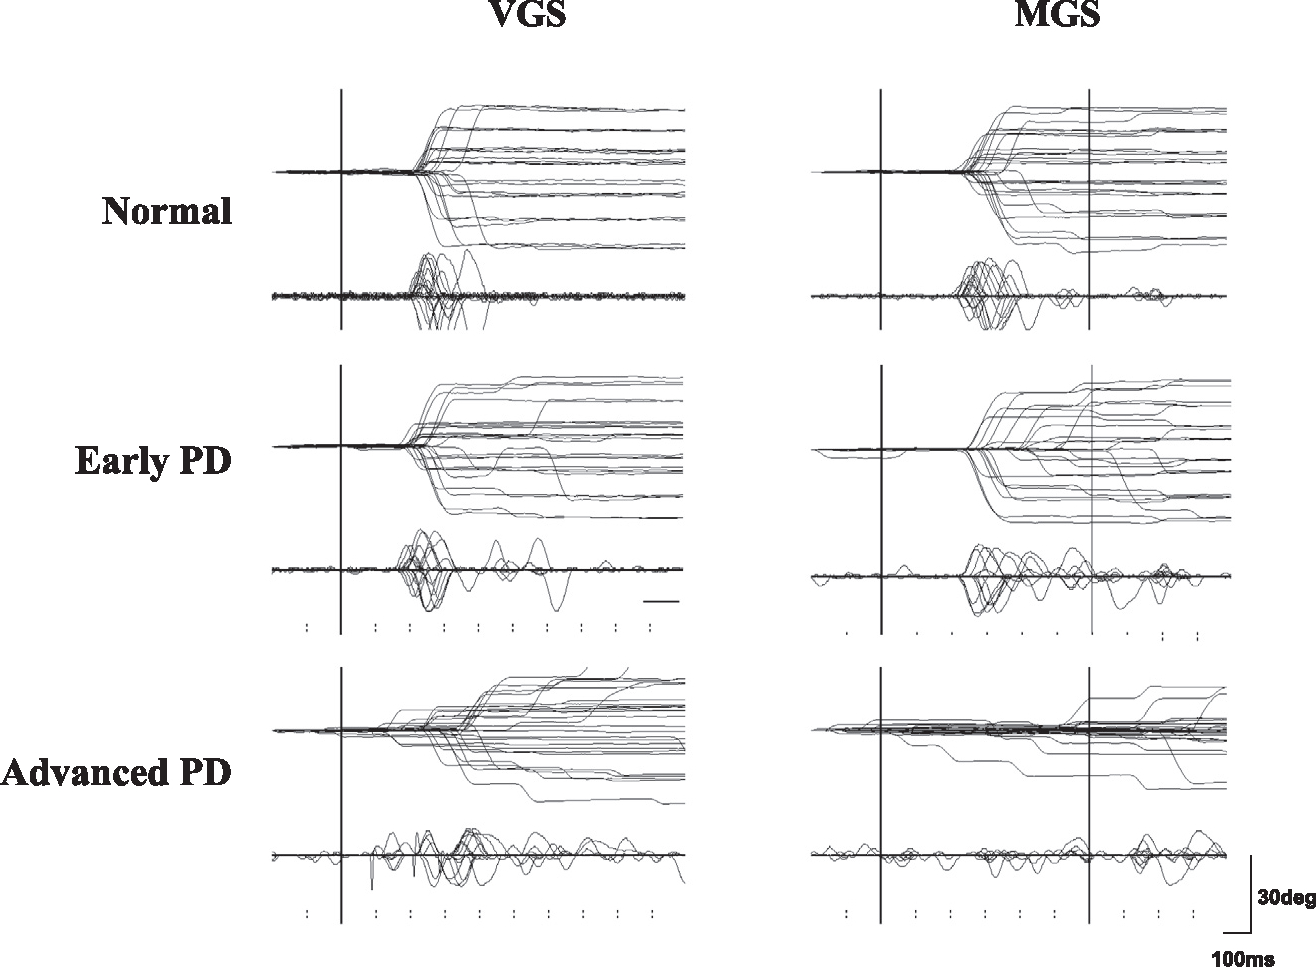
Fig. 3.

Traces of VGS and MGS. Traces of VGS and MGS in a normal subject (top row) and in a single patient with early and advanced PD (middle and bottom rows). Horizontal electro-oculographic (EOG) recordings were made using two Ag–AgCl gel electrodes of 1.0 cm diameter placed at the bilateral outer canthi with an adhesive margin. Vertical EOG recordings were made using the same electrodes placed above and below the right eye. The signals were fed to a DC amplifier that was low-pass filtered at 20 Hz and then digitized (500 Hz). Twenty to 30 trials of eye movements (upper traces) and velocity curves (lower traces) are superimposed and are time-locked to the presentation of the target (VGS) or to the offset of the central fixation point (MGS). The abscissa is the time axis and the ordinate gives the angle. Note the hypometria both in the VGS and MGS tasks, especially for the latter at advanced disease stages. Initiation of MGS is impaired at advanced stages of PD. Reproduced with permission from Terao et al. (2011a).
