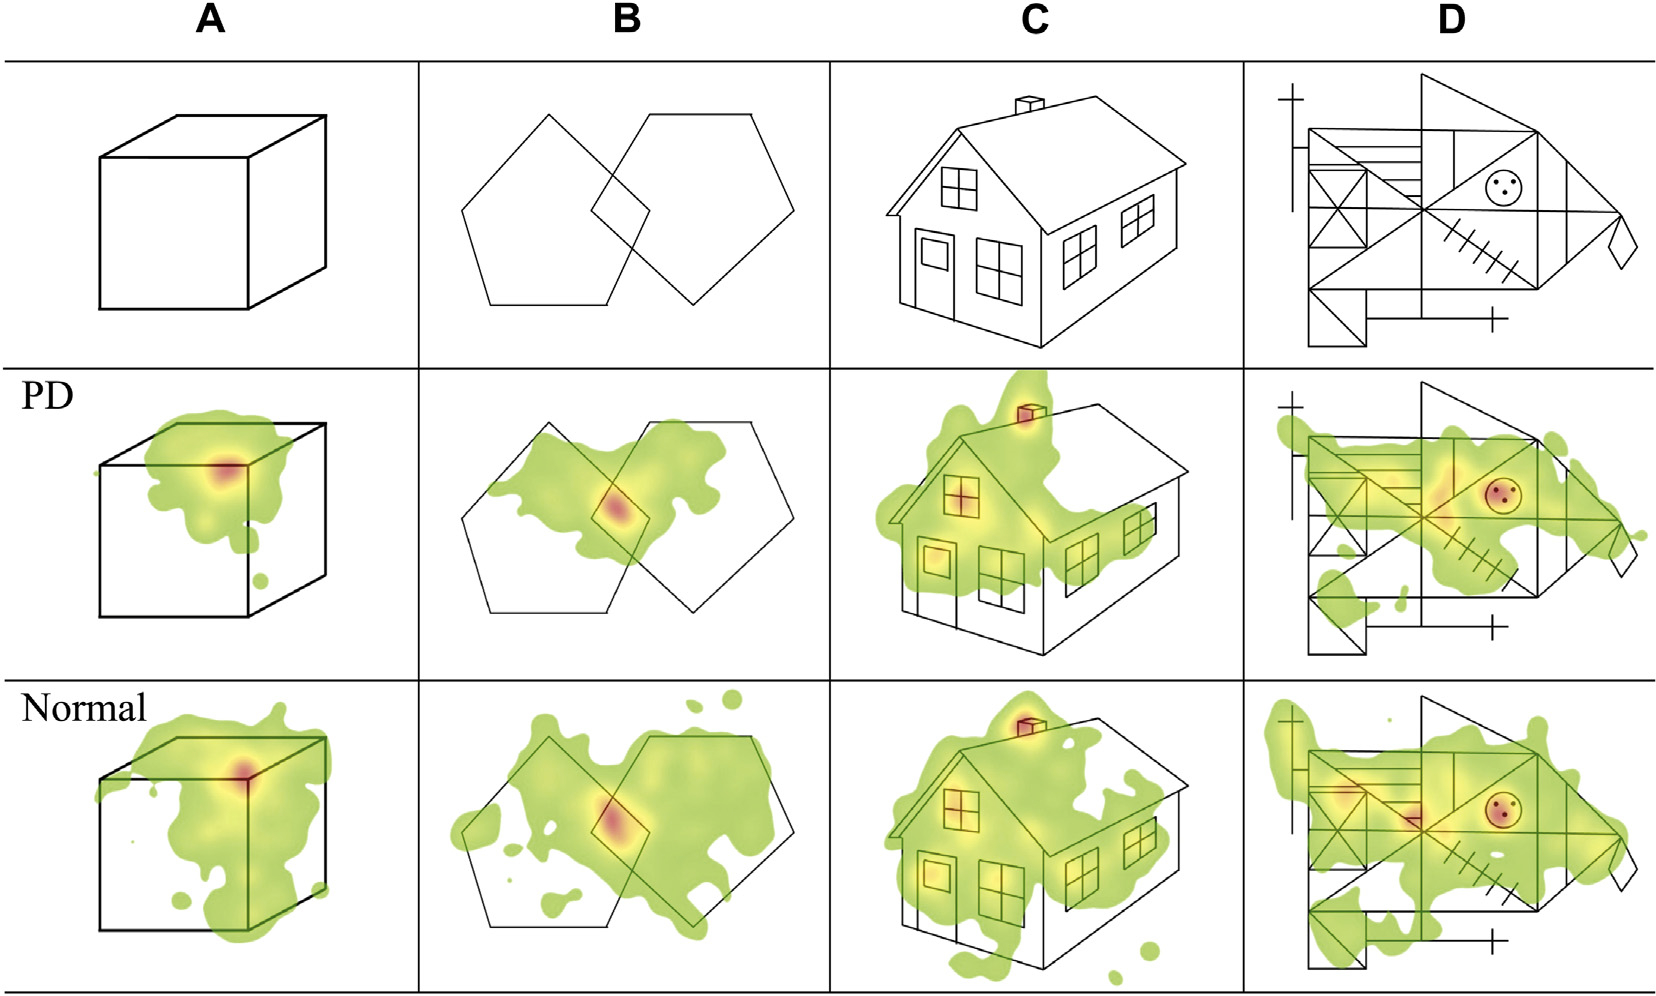
Fig. 6.

Ocular bradykinesia impairs visual exploration in Parkinson’s disease. The figures show color-coded maps (heat maps) of the distribution of fixation when normal subjects and PD patients view pictures of increasing complexity (from left to right). A: image 1 (a cube), B: image 2 (two pentagons combined in different orientations), C: image 3 (a house), D: image 4 (the Rey–Osterrieth complex figure). Heat maps, or graphical color-coded maps showing the distribution of eye-fixation positions, were created for each image. Heat maps color-coded in red, yellow, and green according to the duration of fixation were overlaid onto each of the images. The upper panels show the images presented to the subjects. The middle panels show the heat maps in PD patients and the lower panels those in normal subjects. In all images, the distribution of eye-fixation position (green-colored area) in PD patients was narrower than that in normal subjects. Reproduced with permission from Matsumoto et al. (2011).
