
Figure 2. Novelty induced the redistribution of unit activity.
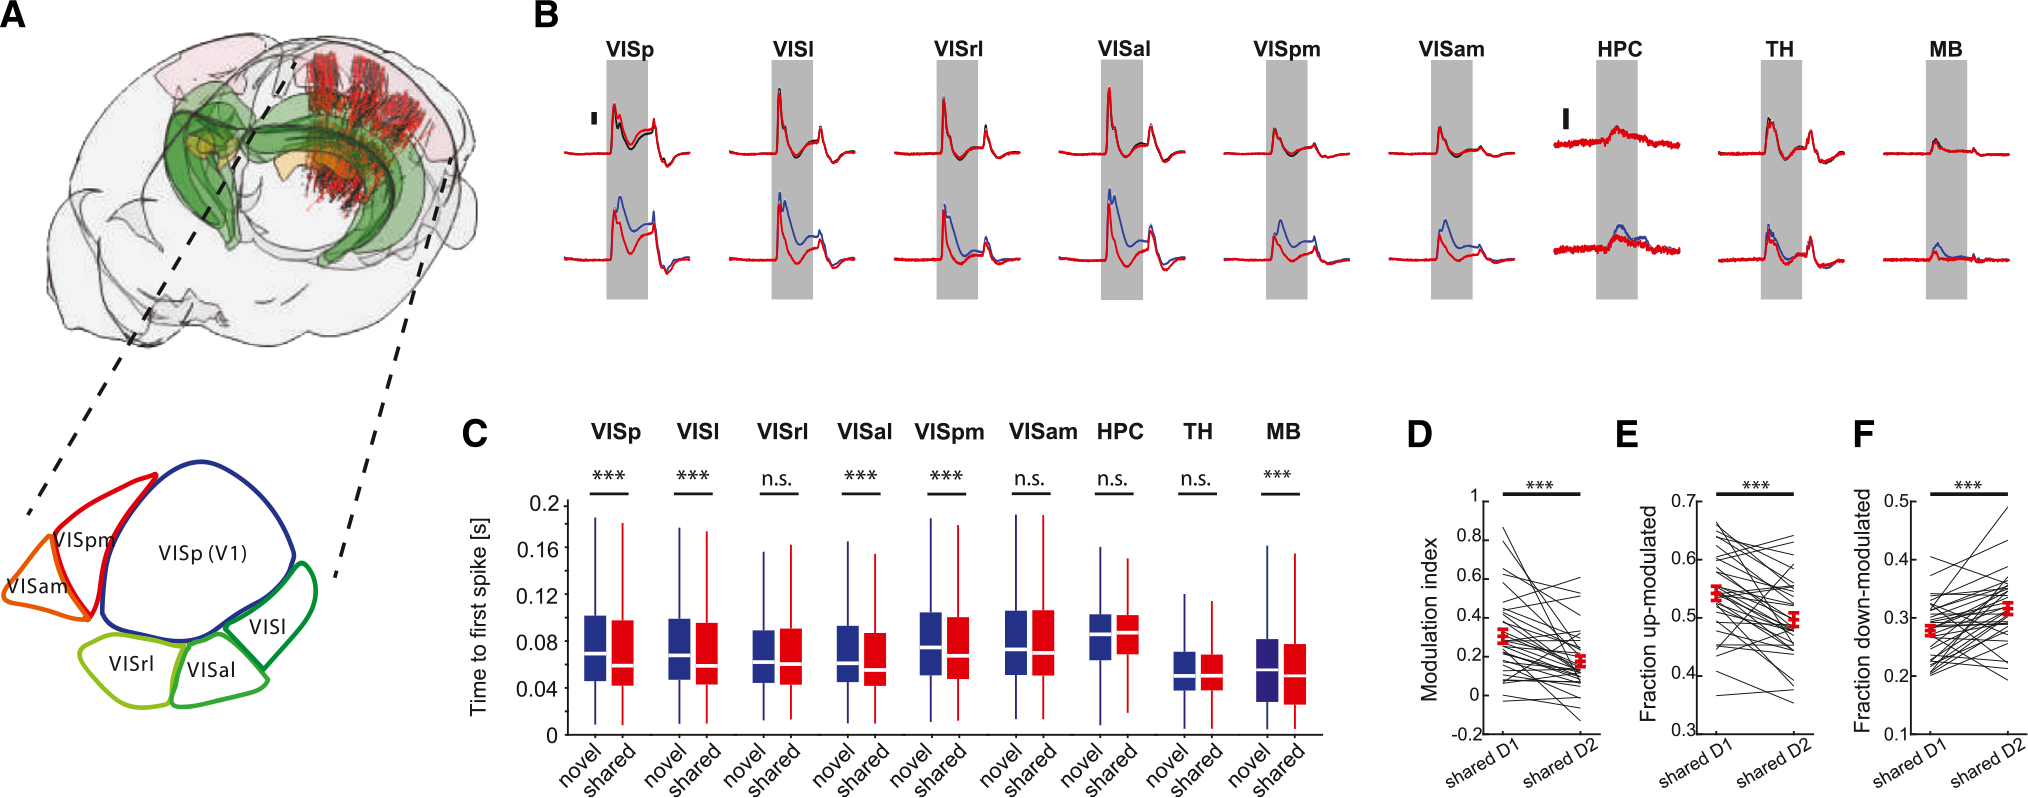
(A) Top: cartoon of the mouse brain showing the location of neurons recorded across all sessions on day 1 (n = 38 sessions, black dots) and day 2 (n = 37 sessions, red dots). Visual cortex, hippocampus, and visual thalamus are depicted in pink, green, and yellow, respectively. Bottom: schematic illustration of the mouse visual cortex.
(B) Baseline subtracted mean responses of units in the different areas included in the dataset to familiar (black) and shared (red) images on day 1 (top) and novel(blue) and shared (red) images on day 2 (bottom). Note the differences in response magnitude between novel and shared images on day 2. Scale bars, 0.5 Hz for hippocampus and 2 Hz for all other areas (n = 961–7,800 neurons per area).
(C) Distribution of median lags to first spike after image presentation for novel vs. shared images on day 2. Note the significantly shorter lags in response to sharedimages for the majority of the visual cortical areas.
(D) Comparison of modulation index to shared images on day 1 and day 2 (***p < 0.001, Wilcoxon signed-rank test, n = 35 mice recorded on both days).
(E and F) Same as (D), for the fraction of significantly up-modulated cells and down-modulated cells, respectively.