
Figure 5. Novelty affects adaptation to familiar stimuli.
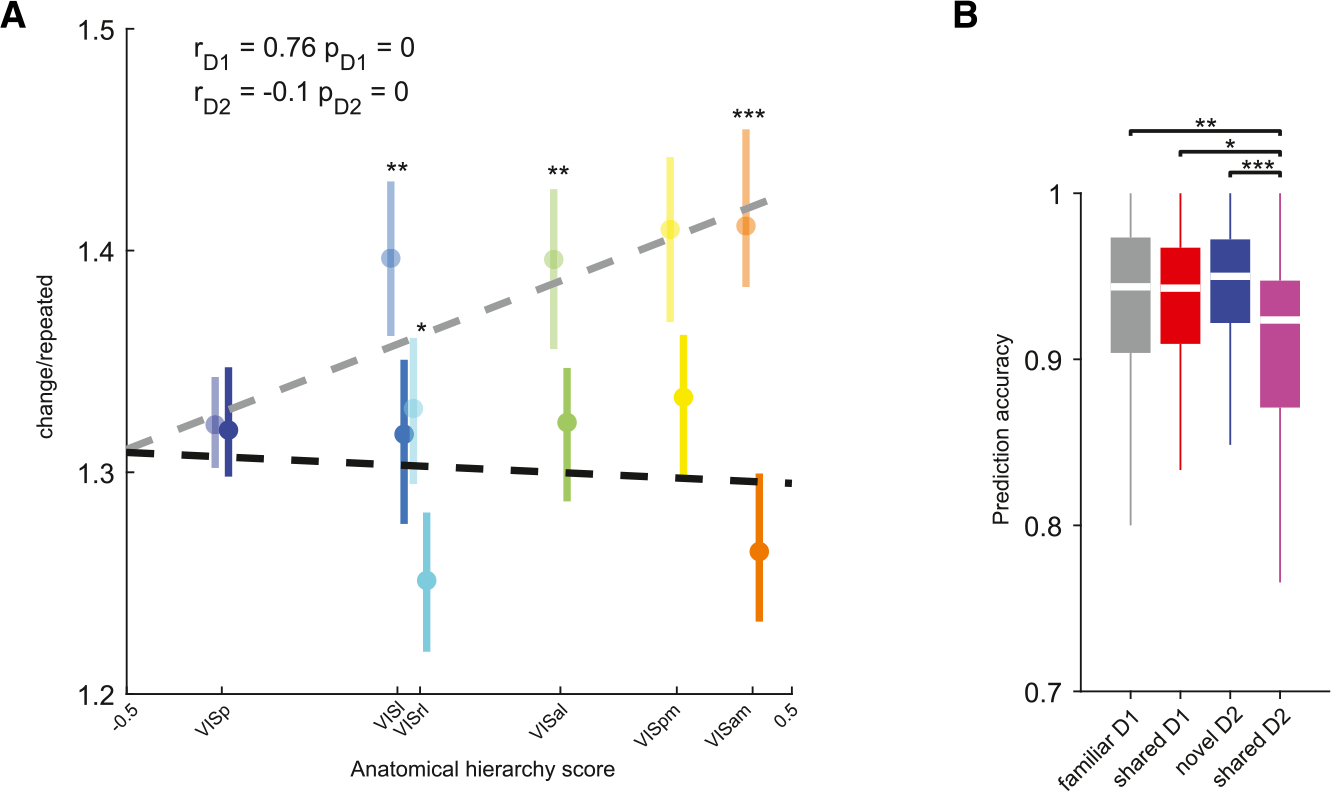
(A) Ratio of responses (median ± 95% confidence intervals) to changed/repeated presentations of shared images on day 1 (opaque) and day 2 (bright colors) during the active task, plotted against each area’s anatomical hierarchy score. Ratios were significantly lower on day 2 in higher-order visual areas, but not in VISp (**p < 0.01, ***p < 0.001, Bonferroni-Holm corrected Wilcoxon rank-sum test; see Figure S7 for sample size summary). Pearson’s correlation coefficients and p values are indicated in the top left corner. Regression lines are plotted as dashed lines in the respective color.
(B) Prediction accuracy of a cross-validated linear classifier trained to distinguish changed and repeated presentations of the same image from normalized spike counts of all visual cortex neurons during the active task (*p < 0.05, **p < 0.01, ***p < 0.001, Kruskal-Wallis with Tukey-Kramer post hoc tests; n = 38 sessions on day 1 and 37 sessions on day 2).