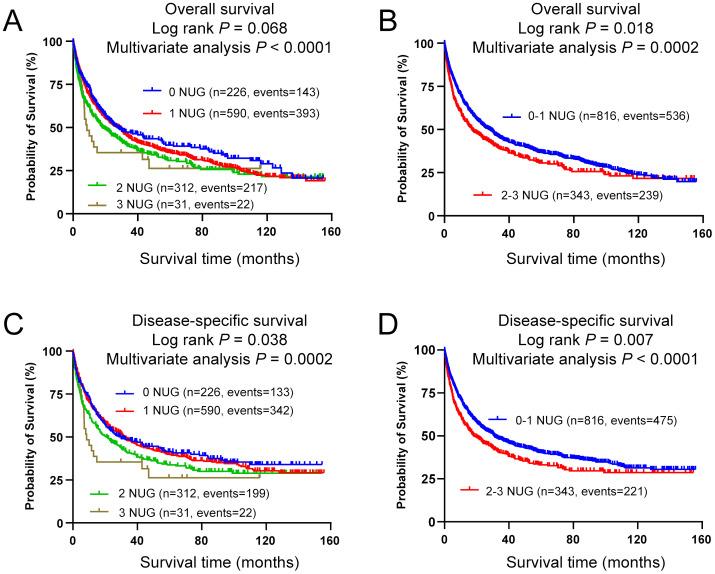
Figure 5.
Prediction of survival with combined unfavorable genotypes. Kaplan-Meier survival curves in the PLCO dataset for (A) OS with the combined unfavorable genotypes, (B) OS with the dichotomized groups of the NUGs, (C) DSS with the combined unfavorable genotypes, (D) DSS with dichotomized groups of the NUGs. Unfavorable genotypes were LRRC8C rs10493829 TT, OAS2 rs2239193 AG+GG, and CCL25 rs3136651 TT.

