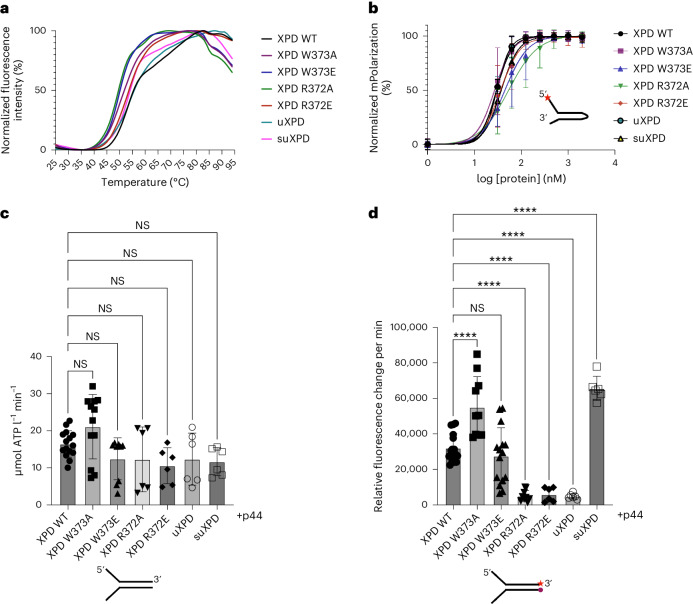
Fig. 3. Functional characterization of XPD variants.
a, Normalized thermal unfolding curves of XPD and XPD variants analyzed in this work. Melting points were derived from these curves using GraphPad Prism. b, Binding curves obtained from fluorescence anisotropy experiments using a 5′ overhang hairpin substrate. The curves were fitted using GraphPad Prism, resulting in the KD values given in Extended Data Table 1. Experiments were performed in at least three technical replicates. Mean values are plotted with their associated s.d. The red star marks the Cy3 label. c, ATPase activity of XPD and its variants in the presence of a Y-forked substrate and p44. Experiments were performed in at least three technical replicates and one biological replicate. NS, not significant. d, Helicase activity of XPD and its variants in the presence of a fluorescently labeled Y-forked substrate and p44. The red star denotes the Cy3 label at the 3′ end that is quenched by a Dabcyl moiety at the 5′ end of the complementary strand. Experiments were performed in at least three technical replicates and one biological replicate. Data were analyzed using GraphPad Prism. All values are also listed in Extended Data Table 1. Asterisks indicate significance determined by ordinary one-way analysis of variance (ANOVA) testing in GraphPad Prism. ****P > 0.0001. All error bars represent the s.d. Number of samples: WT XPD, b (n = 10), c (n = 15) and d (n = 16); XPD W373A, b (n = 10), c (n = 12) and d (n = 10); XPD W373E, b (n = 10), c (n = 9) and d (n = 15); XPD R372A, b (n = 10), c (n = 6) and d (n = 9); XPD R372E, b (n = 10), c (n = 6) and d (n = 6); uXPD, b (n = 3), c (n = 6) and d (n = 6); suXPD, b (n = 3), c (n = 6) and d (n = 6).

