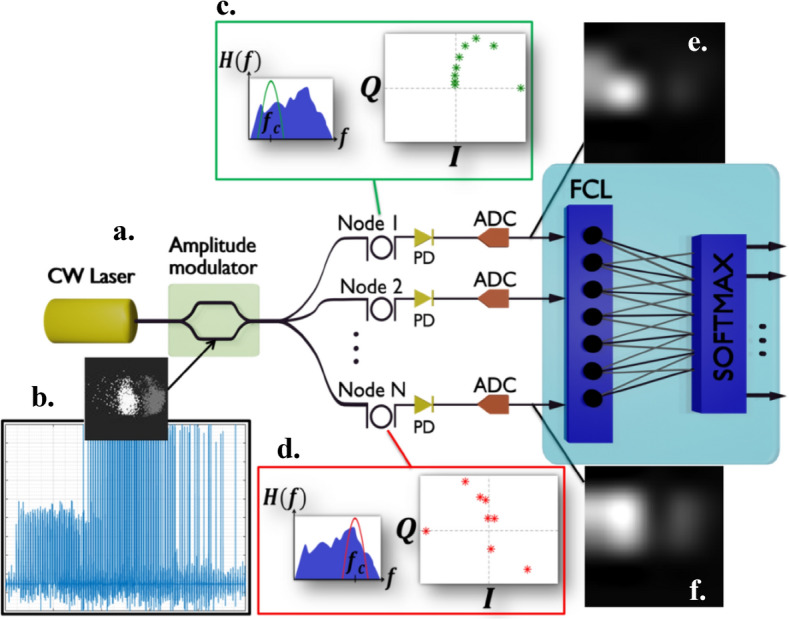
Fig. 5.

Schematic diagram of the OSS-CNN for the classification of IFC experimental data. (a) The synergy of a continuous-wave laser, a DAC and an MZM, used to imprint the 1D synthetic frame vectors onto the amplitude of the optical carrier. (b) A flattened IFC synthetic frame after laser modulation, displayed alongside the original synthetic frame. (c-d) Complex-valued coefficients (I/Q) for two identical filters, positioned at different detunings relative to the signal’s carrier frequency. (e–f) Reconstructed images after processing through two discrete OSS nodes.
