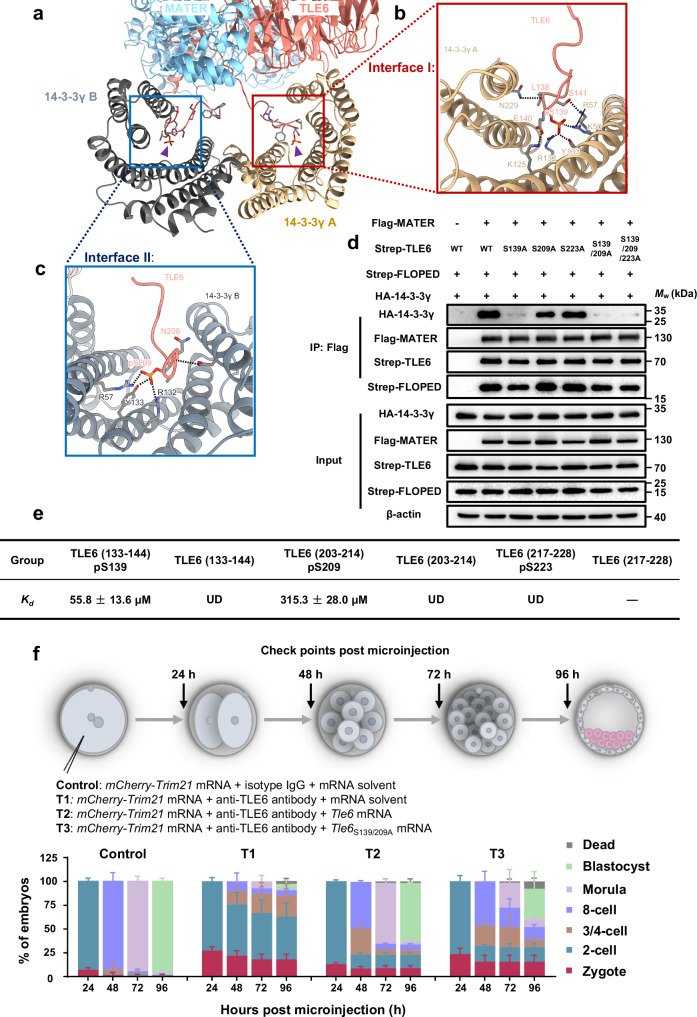
Fig. 2. Site-specific phosphorylation of TLE6 is important for binding 14-3-3.
a–c Interface I and II mediating the binding of two 14-3-3γ protomers to TLE6 in the SCMC. Interface I (b, marked in red box) and Interface II (c, marked in blue box) show the interactions of two 14-3-3γ protomers with TLE6 pS139 and pS209, respectively. Purple triangles indicate TLE6 pS139 and pS209, respectively. pS, phosphorylated serine. Single components are colored and labeled as denoted. d HEK-293F cells were co-transfected with expression vectors harboring Flag-tagged MATER (or a blank vector for negative control), Strep-tagged FLOPED, HA-tagged 14-3-3γ and either Strep-tagged TLE6, TLE6S139A mutant, TLE6S209A mutant, TLE6S223A mutant, TLE6S139/209A double-site mutant, or TLE6S139/209/223A triple-site mutant as denoted. 60 h after transfection, cell lysates before (Input) or after immunoprecipitation with anti-Flag affinity agarose gel were immunoblotted for HA-tagged 14-3-3γ, Flag-tagged MATER, Strep-tagged FLOPED and Strep-tagged TLE6 (or mutants). e Table for binding affinity (Kd) between His-tagged 14-3-3γ and TLE6 wildtype peptides (TLE6 (133–144) or TLE6 (203–214)) or phosphorylated peptides (TLE6 (133–144) pS139, TLE6 (203–214) pS209, or TLE6 (217–228) pS223). The data represent the mean ± S.D. (standard deviation) of 3 independent experiments. pS, phosphorylated serine. UD, undetectable. The minus symbol “-” indicates that the peptide TLE6 (217–228) was undetermined due to insolubility. f Schematic overview of mouse zygotes cultured for 24, 48, 72, and 96 h after co-microinjection with mCherry-Trim21 mRNA + isotype IgG + mRNA solvent (control), mCherry-Trim21 mRNA + anti-TLE6 antibody + mRNA solvent (T1), mCherry-Trim21 mRNA + anti-TLE6 antibody + Tle6 mRNA (T2), or mCherry-Trim21 mRNA + anti-TLE6 antibody + Tle6S139/209A mRNA (T3). The validation for the loss of TLE6 was presented in Supplementary Fig. 7b. The proportions of embryos on different stages were calculated. N = 3 independent experiments. The data are presented as the mean ± S.D.

