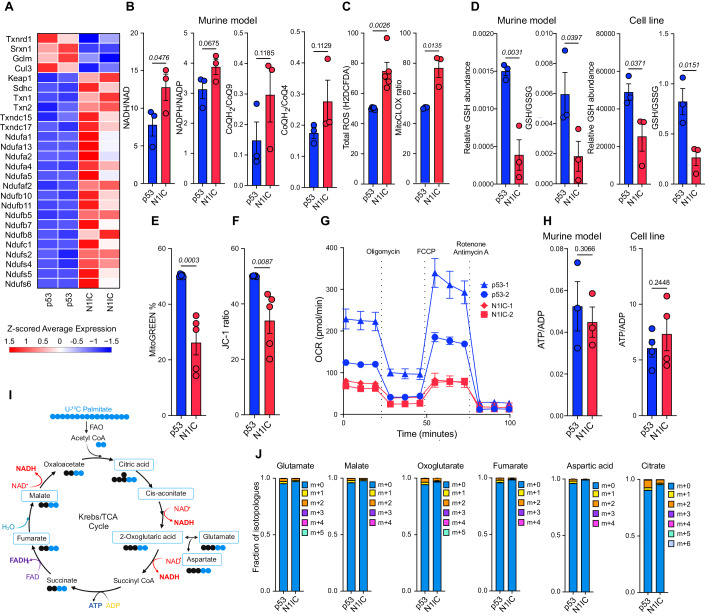
Figure 3. Altered complex I activity leads to increased ROS and mitochondrial lipid peroxidation in the N1IC AC-like model.
(A) Heatmap showing differentially expressed genes involved in complex I activity or redox metabolism identified by scRNA-seq in the p53 and N1IC transformed cell populations. n = 2 samples for each model. (B) Bar graph depicting mean ratio ± SEM of reductive substrates based on LC-MS analysis of tumor tissue from the p53 and N1IC murine models. n = 3 samples for each model. P-values calculated by unpaired one-tailed t-test. Also refer to Dataset EV3. (C) Bar graph depicting mean ± SEM H2DCFDA and MitoCLOX ratio demonstrating increased ROS and mitochondrial lipid peroxidation in N1IC primary cultures compared to p53. Data pooled from n = 5 (H2DCFDA) and n = 3 (MitoCLOX) independent experiments. P-values calculated by unpaired two-tailed t-test. (D) Bar graphs depicting mean GSH relative abundance and GSH/GSSG ratio ± SEM in the murine tumors and primary cell cultures from p53 and N1IC models. P-values calculated by unpaired one-tailed t-test. n = 3 independent tumor samples for each model (murine model, left) and n = 3 independent measurements in a pair of cell lines (cell line, right). (E) Bar graph of MitoGREEN median gate ± SEM demonstrating difference in mitochondrial numbers in p53 and N1IC primary cell cultures. P-values calculated by unpaired two-tailed t-test. Data pooled from n = 5 independent experiments. (F) Bar graph depicting mean ± SEM JC-1 ratio demonstrating decreased mitochondrial membrane potential in N1IC compared to p53 primary cell cultures. Data pooled from n = 5 independent experiments. P-values calculated by unpaired two-tailed t-test. Also refer to Appendix Fig. S4. (G) Seahorse OCR analysis of two different p53 and N1IC primary cell cultures demonstrating higher energetic metabolism in p53 tumor cells compared to N1IC tumor cells. Each point represents mean, error bars represent SEM of minimum n = 3 replicates. Also refer to Appendix Fig. S4. (H) Bar graph depicting mean ATP/ADP ratio ± SEM in murine tumors and primary cell cultures demonstrating no difference in energetic balance between the p53 and N1IC models. n = 3 (tumors) or n = 4 (cell culture) independent samples for each model. P-values calculated by unpaired two-tailed t-test. (I) Schematic depiction of C13 palmitate flux analysis to measure fatty acid oxidation (FAO) in primary cell cultures. Boxed metabolites were measured and are depicted in Panel (J). (J) Quantification of TCA cycle metabolites incorporating C13 from FAO of tagged palmitic acid demonstrates increased uptake in the p53 primary cell cultures. Stacked bar graphs depict mean ± SEM from n = 3 independent measurements. Source data are available online for this figure.

