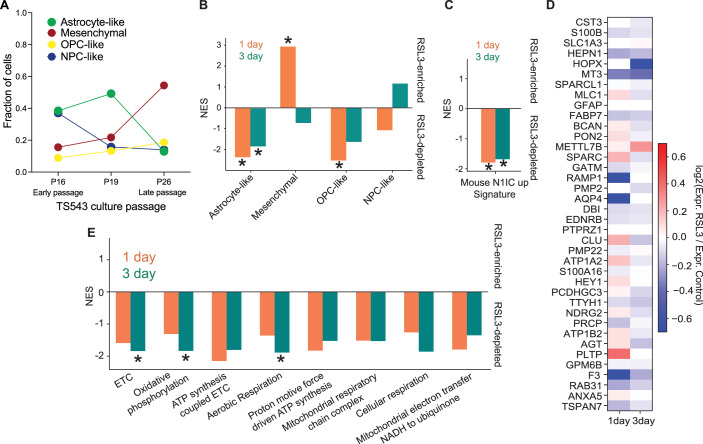
Figure 6. GPX4 inhibition targets an AC-like subpopulation in an early passage patient derived cell line.
(A) The phenotypic cell states of TS543 culture change over time. The cell state of each cell from scRNA-seq data of 3 different TS543 culture passages was determined using gene signatures described in Neftel et al (2019). Number of cells at each cell state were counted and used to calculate the cell fraction at each culture passage. (B) Normalized enrichment scores (NES) for glioma cell state-specific gene signatures comparing the vehicle-treated and RSL3-treated TS543 glioma neurospheres treated for one (orange) or three (green) days showing consistent depletion of the astrocyte-like cell state. (C) Same as (B). but for the mouse “N1IC_up” astrocyte-like gene signature showing consistent depletion for both treatment times. (D) Heatmap showing differential expression fold-changes comparing vehicle- and RSL3-treated TS543 neurospheres at one and three days for markers of the astrocyte-like signature. (E) Same as (A). but for mitochondrial metabolic gene signatures showing consistent depletion for both treatment times and significant depletion of ETC, oxidative phosphorylation, and aerobic respiration at day 3. For all panels, * indicates FDR < 0.05. Source data are available online for this figure.

