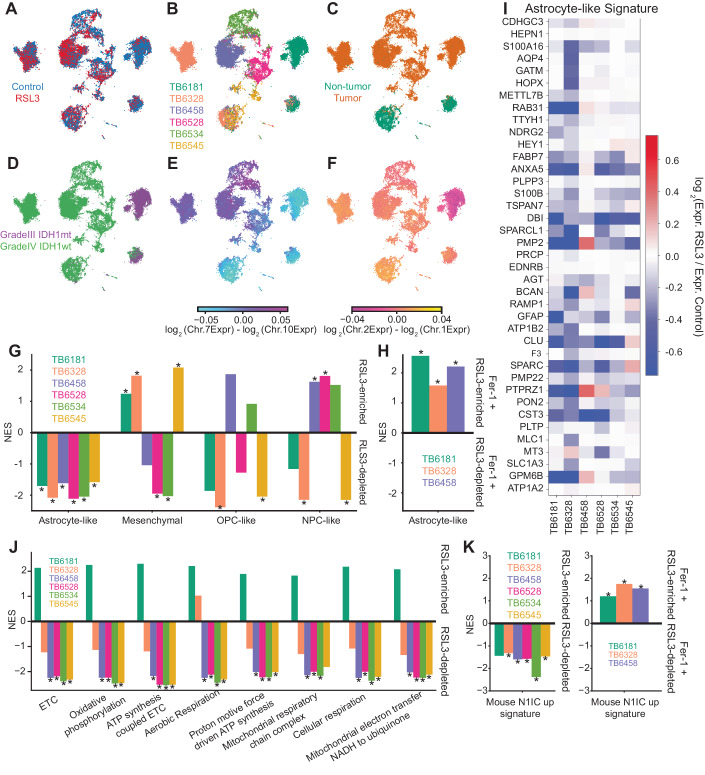
Figure 7. RSL3 targets quiescent AC-like transformed cell populations in acute slice cultures from human glioma.
(A–F) UMAP embedding of scRNA-seq data from vehicle- and RSL3-treated slice cultures from six gliomas, including five primary GBMs and one primary IDH1 mutant adult-type diffuse glioma. Panel (A) shows the cells annotated by treatment; control (Blue), RSL3 (Red). Panel (B) shows the cells annotated by tumor. Panel (C) shows cells annotated as non-tumor (green) or tumor (orange). Panel (D) shows cells annotated by IDHmt (purple) or IDHwt (green). Panels (E) and (F) show cells annotated by chromosomal copy number alterations. Also refer to Appendix Fig. S11. (G) Normalized enrichment scores (NES) for glioma cell state-specific gene signatures comparing the vehicle treated vs. RSL3 treated slices for all 6 cases. (H) NES for the astrocyte-like gene signature, comparing RSL3 treated vs. RSL3+Ferrostatin-1 treated slices for 3 of the 6 cases. (I) Heatmap of the fold-change for each gene in the astrocyte-like gene signature across all six patients comparing the vehicle and RSL3 treated slices. (J) GSEA of mitochondrial metabolic signatures comparing the transformed glioma cells in the vehicle and RSL3 treated slices. (K) Normalized enrichment scores for the “N1IC_up” gene signature derived from the murine model comparing the vehicle treated vs. RSL3 treated slices for all 6 cases. Right panel depicts the same gene signature comparing RSL3 treated vs. RSL3+Ferrostatin-1 treated slices for 3 of the 6 cases. Panels (G), (H), (J), (K): Significant (FDR-corrected p < 0.05) NES marked with asterisk (*). Source data are available online for this figure.

