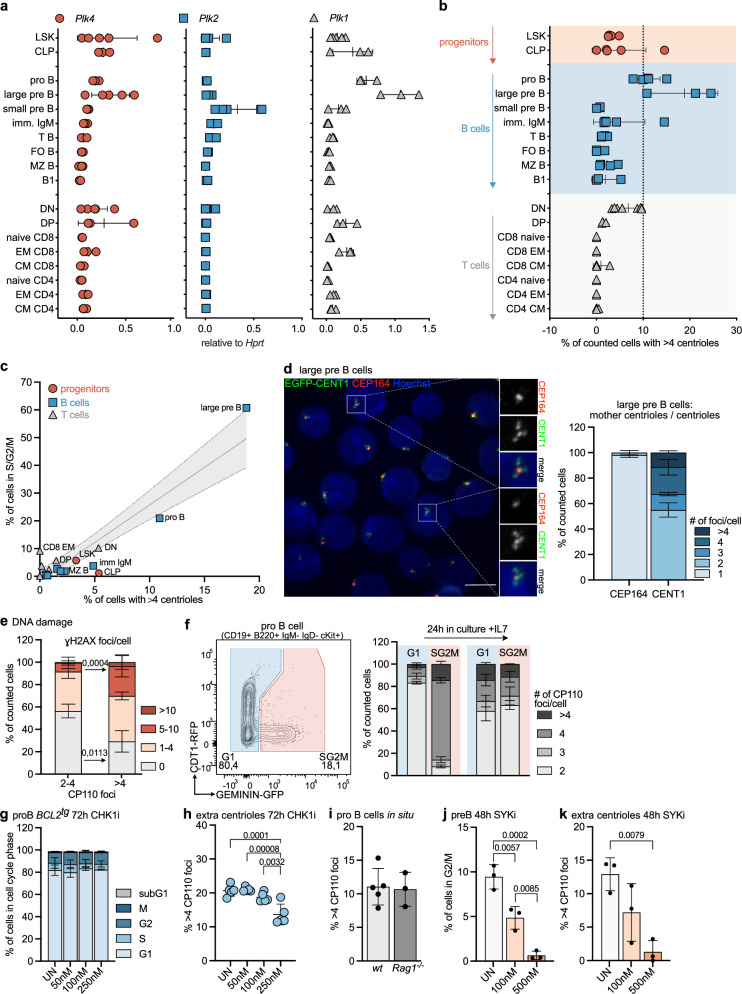
Fig. 1. B cell progenitors display aberrant centriole numbers.
a qRT-PCR of Plk4, Plk2, and Plk1 mRNA normalized to Hprt in bone marrow: Lin-Sca1 + c-Kit + (LSK), common lymphoid progenitor (CLP), pro B, large, small pre B and immature IgM + B cells; spleen: transitional (T B) B cells, follicular (FO B) B cells, marginal zone (MZ B) B cells, CD4, CD8 naive, effector memory (EM) and central memory (CM) T cells; thymus: double negative (DN) and double positive (DP) thymocytes; peritoneum: B1 B cells (B1). n = 3 (except DN, large pre B (Plk4 and Plk2) n = 5 and LSK (Plk4, Plk2, Plk1) n = 5) biological replicates b Percentage of counted cells with > 4 centrioles. Centriole number was determined by IF staining for ɣ-Tubulin, CP110 antibody staining, and Hoechst. n = 3 (except T B n = 4 and DN, imm IgM + , pro B, CLP n = 5). c Correlation of fraction of cells with > 4 centrioles with a fraction of cells in S/G2/M, determined in mice expressing a FUCCI reporter. n = 3. d Immunofluorescence quantification of EGFP-CENT1 + large pre B cells stained with αCEP164. Scale bar = 5 µm. e Quantification of γH2AX foci in cells with ≤ 4 centrioles or 2–4 centrioles by IF. n = 3. f Representative dot-plots identifying FUCCI + pro B cells in G1 and S/G2/M. Centriole distribution was assessed directly after sorting and after 24 h in culture by IF using αɣ-Tubulin, αCP110, and Hoechst. n = 3. g Cell cycle profile of pro B cells after 72 h in culture with different concentrations of CHK1i (PF 477736). UN = untreated, n = 3. h The fraction of cells with > 4 EGFP-CENT1 foci was determined by IF. n = 5 (50 vs. 250 nM p < 0.0001 = . 0,000081). i Percentage of pro B cells from wt and Rag1-/- animals with > 4 CP110 foci, stained as in (b). n = 6 (wt) n = 3 (Rag1-/-). j Pre B cells expanded on OP9 cells treated with SYK-inhibitor (R406). The percentage of G2/M cells was analyzed via flow cytometry. n = 3. k Percentage of SYKi-treated pre B cells with extra centrioles. n = 3. Error bars in all panels represent mean ± SD of biological replicates (individual mice) One-way-ANOVA Tukey’s multiple comparisons test (h, j, k) and Two-way-ANOVA, Bonferroni’s multiple comparisons (e). Source data are provided as a Source Data file.

