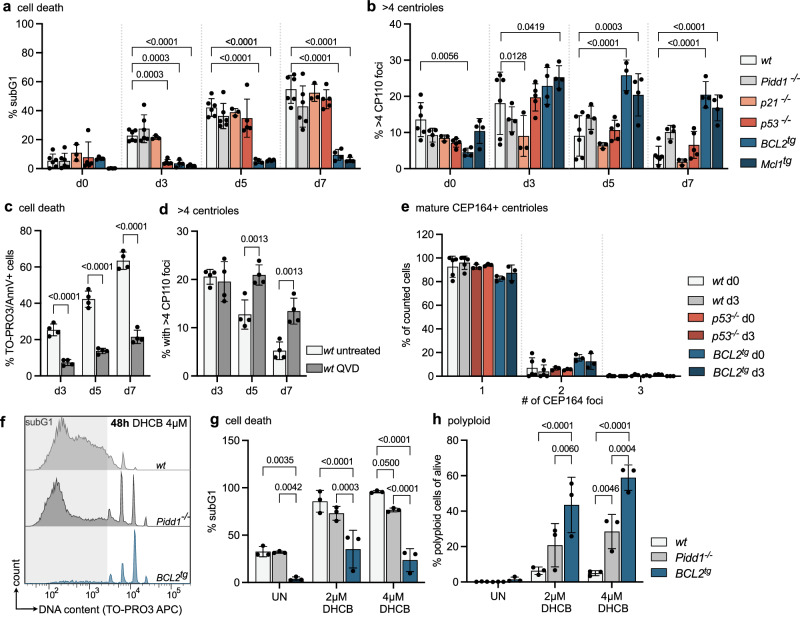
Fig. 2. Extra centrosomes correlate with apoptosis induction in progenitor B cells.
a Pro B cells were FACS-sorted from mice of the indicated genotypes, and flow cytometry was used to determine the fraction of dead pro B cells (subG1) after sorting (d0) or in culture after 3, 5, and 7 days (d3, d5, d7) with IL-7. wild type wt (n = 5), Pidd1-/- (n = 6), p21-/- (n = 3), p53-/- (n = 5), BCL2tg (n = 4) and Mcl1tg (n = 4). b Percentage of counted cells with more than 4 centrioles, determined by immunofluorescence with ɣ-Tubulin and CP110 antibody staining and Hoechst nuclear staining. wt (n = 6), Pidd1-/- (n = 4), p21-/- (n = 3), p53-/- (n = 5), BCL2tg (n = 3 d5, n = 4 d0, d3, d7) and Mcl1tg (n = 4). c TO-PRO3 + /Annexin V + untreated or QVD-treated wt pro B cells were assessed via flow cytometry after 3,5 and 7 days of culture. n = 4; d Percentage of counted cells with more than 4 centrioles, determined by immunofluorescence with ɣ-Tubulin and CP110 antibody staining and Hoechst nuclear staining. n = 4; e Bar graph showing the percentage of wt (n = 5), p53-/- and BCL2tg (n = 3) pro B cells with 1,2 or 3 mature CEP164 + centrioles directly after sorting (d0) or after 3 days in culture (d3) with IL-7. CEP164 foci were determined by immunofluorescence with ɣ-Tubulin and CEP164 antibody and Hoechst nuclear stain. f Flow cytometry histograms of DNA marker TO-PRO3 of pro B cells expanded for 3 days with IL-7 and then treated with DMSO (UN) or 2, 4 µM DHCB for 48 h. g Fraction of cells in subG1. wt, Pidd1-/-, BCL2tg (n = 3). h Fraction of polyploid cells alive, wt, Pidd1-/-, BCL2tg (n = 3). Error bars in all panels represent the mean ± SD of biological replicates (individual mice). Genotypes were compared by two-way-ANOVA Tukey’s multiple comparisons test (g, h) and Bonferroni’s multiple comparisons test (a-b to compare to wt, and c, d). Source data and exact p-values (< 0.0001) are provided as a Source Data file.

