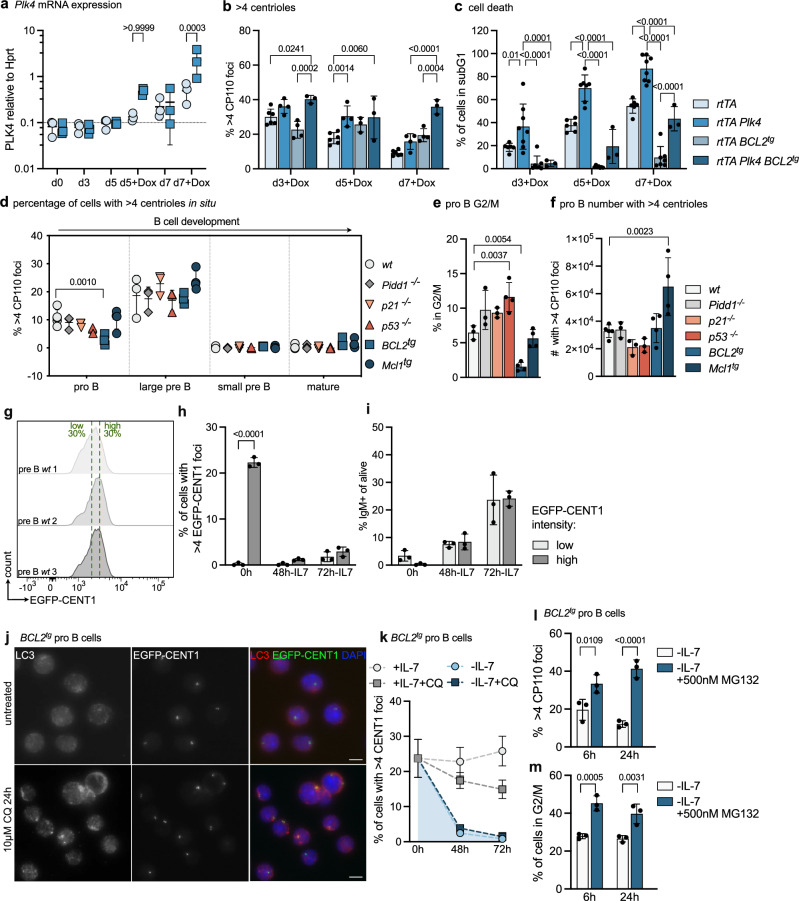
Fig. 3. Extra centrosomes promote cell death in progenitor B cells.
a Doxycyclin (Dox) was added after 48 h to pro B culture. qRT-PCR analysis was used to determine Plk4 mRNA relative to Hprt. n = 3. b Fraction of counted cells with more than 4 CP110 foci was determined by immunofluorescence (IF). n = 6 rtTA, n = 4 rtTA Plk4, n = 3 rtTA BCL2tg, n = 3 d5 and n = 4 d3 and d7 rtTA Plk4 BCL2tg; c The fraction of dead subG1 cells was determined by flow cytometry. n = 6 rtTA, n = 8 rtTA Plk4, n = 7 rtTA BCL2tg, n = 3 rtTA Plk4 BCL2tg; d FACS-sorted B cells with > 4 centrioles by IF (α-CP110, α-ɣ-Tubulin). Bone marrow: pro B, large, small pre B; Spleen: follicular B (mature). n = 3, except wt pro B n = 5 and Mcl1tg (n = 4). e Fraction of pro B in the G2/M phase of the cell cycle after isolation. n = 3, except n = 4 p53-/-, BCL2tg, Mcl1tg; f Calculated number of pro B cells with extra centrioles (fraction of cells with extra centrioles times number of sorted cells). n = 3 for Pidd1-/-, p21-/-, n = 4 for BCL2tg, Mcl1tg n = 5 for wt; g Flow cytometric histograms of high/low EGFP-CENT1 pre B cells. h Fraction of pre B cells with >4 EGFP-CENT1 + foci in the GFP low vs. high population. i. Fraction of pre B cells differentiating to IgM + after 48 or 72 h IL-7 withdrawal by flow cytometry. n = 3. j Representative IF with α-LC3 and DAPI of BCL2tg EGFP-CENT1 + pro B cells untreated (top) or 10 µM Chloroquine treated (bottom) for 24 h. k BCL2tg pro B cells with more than 4 CENT1 foci. n = 3. l BCL2tg pro B with more than 4 CP110. Cells were expanded for 3 days with IL-7 followed by 6 or 24 h IL-7 withdrawal and treatment with 500 nM MG132. m Fraction of cells in the G2/M phase was determined by flow cytometry. Error bars in all panels represent the mean ± SD of biological replicates (individual mice). Groups were compared by two-way-ANOVA Bonferroni’s (a, h–m) or Tukey’s multiple comparisons test (b–d) and one-way-ANOVA Tukey’s multiple comparisons test (e, f). Source data and exact p-values (< 0.0001) are provided as a Source Data file.

