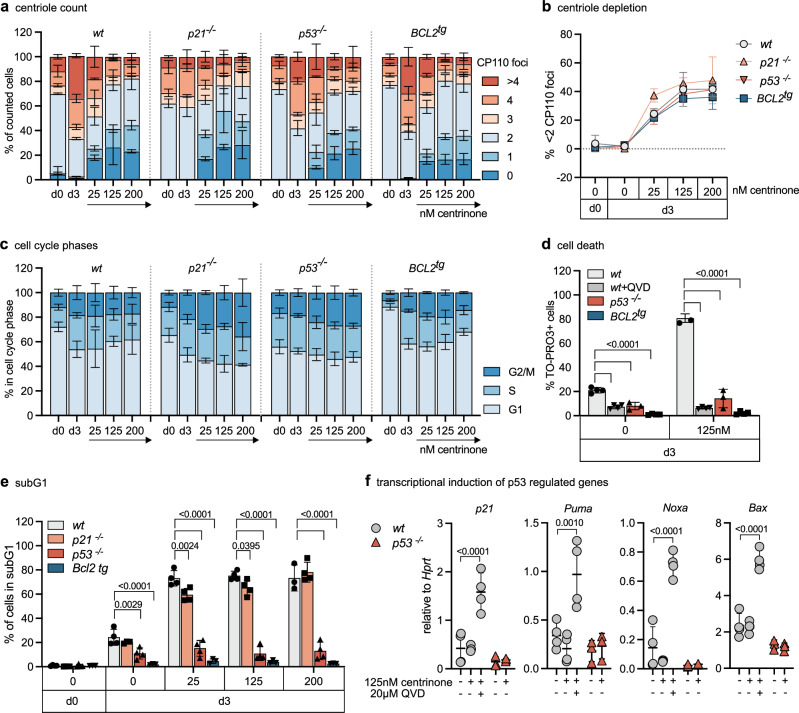
Fig. 4. Centriole loss promotes p53-dependent apoptosis in early B cells.
a FACS-sorted pro B cells of wt, p21-/-, p53-/- and BCL2tg were treated with 25, 125 or 200 nM PLK4-inhibitor centrinone for 3 days in presence of IL-7. Centriole distribution was assessed by immunofluorescence with ɣ-Tubulin, CP110 antibody staining, and Hoechst nuclear staining. n = 3 for all genotypes. b Fraction of cells with < 2 centrioles (centriole depletion). n = 3. c Fraction of cells in the G1-, S-, G2/M phase of the cell cycle was determined by flow cytometric cell cycle analysis. n = 3 for all genotypes. d Bar graph shows the percentage of cells staining positive for the DNA marker TO-PRO3. Pro B cells were cultured for 3 days with IL-7 alone (0) or IL-7 and 125 nM centrinone. Wt cells were additionally treated with pan-caspase inhibitor QVD (wt + QVD). n = 4 (wt, wt + QVD, BCL2tg), n = 3 (p53-/-). e Fraction of cells in the subG1 gate was determined by flow cytometric cell cycle analysis. n = 4 (wt, except 200 nM n = 3, p21-/-, except d3 untreated n = 3, p53-/-), n = 3 (BCL2tg). f qRT-PCR analysis for p21, Puma, Noxa, and Bax relative to housekeeping gene Hprt in pro B cells treated for 48 h with centrinone ± pan-caspase inhibitor QVD. n = 4 (wt) n = 3 (p53-/-); Error bars in all panels represent mean ± SD of biological replicates (individual mice). Two-way-ANOVA Tukey’s multiple comparisons test compared genotypes (d, e), but only comparisons to wt are shown. Two-way-ANOVA Tukey’s multiple comparisons test compared treatments within each genotype (f) but only comparisons to untreated control are shown; Source data and exact p-values (< 0.0001) are provided as a Source Data file.

