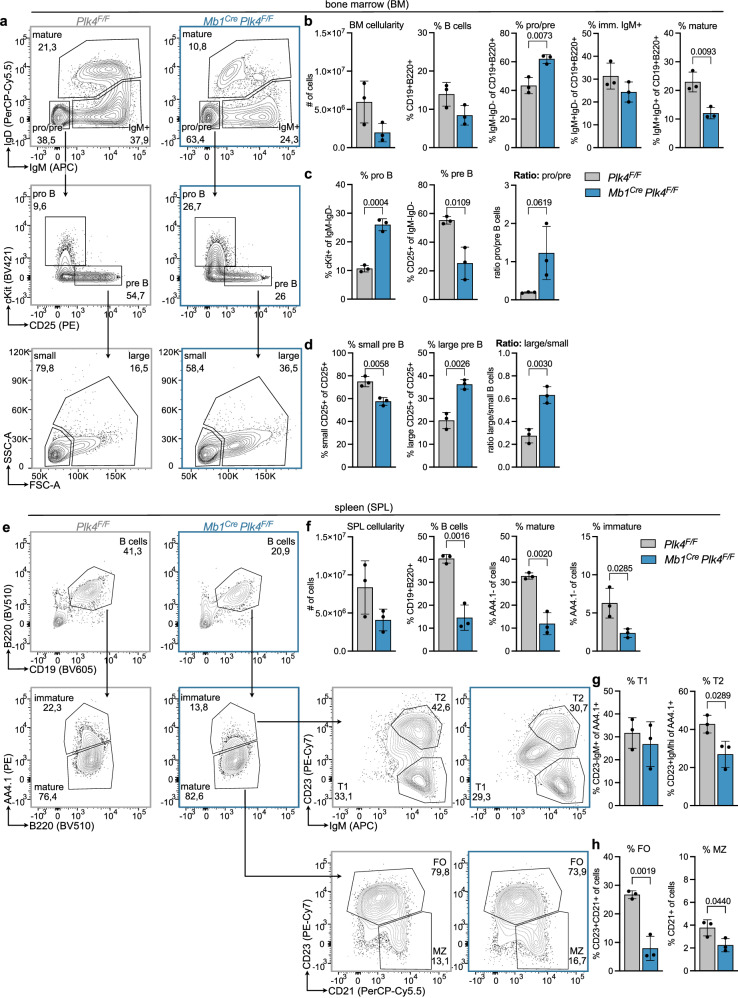
Fig. 5. Loss of PLK4 arrests B cell development.
a Representative FACS plots of control (Plk4F/F) and Mb1Cre Plk4F/F mice illustrating the gating of pro/pre B (IgD-IgM −), immature (IgD-IgM +) and mature B cells (IgD+IgM +) in the bone marrow after pregating on CD19 + B220 + cells; from pro/pre gate further gating on pro B (cKit + CD25-) and pre B (cKit-CD25 +) cells; and from pre B further gating on small and large pre B cells via FSC-A and SSC-A. b Bar graphs show bone marrow cellularity and a fraction of B cells, pro/pre B, immature IgM +, and mature B cells. c Bar graphs show a fraction of pro and pre and the ratio of pro to pre B cells within the pro/pre B cell population. d Bar graphs show the fraction of small and large pre B and the ratio of large to small pre B cells within the pre B cell population. e Representative FACS plots of control (Plk4F/F) and Mb1Cre Plk4F/F mice illustrating the gating of splenic B cells (CD19 + B220 +); immature (AA4.1 +) and mature B cells (AA4.1-); from immature B cell gate further gating on transitional 1 (T1, IgM+CD23-) and transitional 2 (T2, IgM+CD23 +) B cells and from mature B cell gate further gating on follicular (FO, CD23 +) and marginal zone (MZ, CD21 + CD23-) B cells; f Bar graphs show spleen cellularity and fraction of B cells, mature and immature B cells in the spleen. g Bar graphs show the fraction of transitional T1 and T2 cells within the population of immature B cells. h Bar graphs show the fraction of follicular (FO) and marginal zone (MZ) B cells within the population of all cells. Error bars in all panels represent mean ± SD. n = 3 biological replicates for both genotypes (individual mice). Compared to the Student’s two-tailed, unpaired t test; Source data are provided as a Source Data file.

