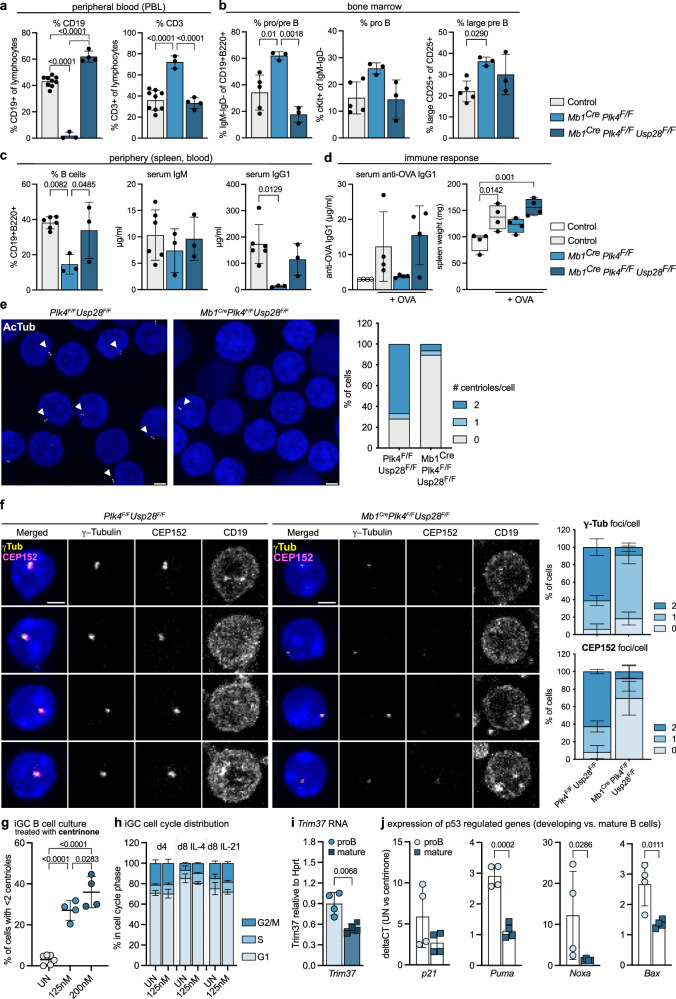
Fig. 6. Co-depletion of USP28 restores B cell development in the absence of PLK4.
a Percentage of CD19+ or CD3+ lymphocytes in the peripheral blood (PBL) of Plk4F/F or Mb1Cre (n = 9, pooled controls), Mb1Cre Plk4F/F (n = 3) and Mb1Cre Plk4F/F Usp28F/F mice (n = 4), determined by flow cytometry. b Fraction of pro/pre B, pro B, and large pre B cells in bone marrow. Control (Plk4 F/F or Plk4 Usp28F/F) n = 5, Mb1Cre Plk4F/F n = 3, Mb1Cre Plk4F/F Usp28F/F n = 3. c Fraction of splenic B cells of the genotypes listed in (b) was determined by flow cytometry. Serum IgM and IgG1 levels were determined by ELISA. d Serum anti-OVA-IgG1 and spleen weight of indicated genotypes were analyzed 13 days post-immunization. n = 4, as control homozygous and heterozygous Plk4 and Usp28F/F mice were pooled. e Expansion microscopy (by factor 4) to determine centriole numbers in splenic B cells with acetylated Tubulin (AcTub) antibody and DAPI staining. Scale bars represent 2.5 µm. n = 96 cells per genotype. f Representative images (left) and number of CEP152 or ɣ-Tubulin foci (right) in CD19 + B cells of PBL by IF with CD19, CEP152, ɣ-Tubulin antibody and DAPI nuclear staining. n = 3. g Centriole depletion assessed by IF with ɣ-Tubulin, CP110 antibodies, and Hoechst staining in iGC B cells cultured on feeder cells with IL-4 for 4 days ± centrinone. n = 6 untreated (UN), n = 4 treatment. h DNA content analysis of iGC B cells (IL-4 for 4 days, + 4 days with either IL-4 or IL-21). n = 3. i Trim37 levels relative to Hprt were assessed by qRT-PCR in pro B and LPS-activated mature splenic B cells treated with 125 nM centrinone plus QVD. Data are shown as mean ± SD. n = 4. j qRT-PCR analysis of p53 target genes in untreated versus centrinone-treated pro B or LPS-treated splenic B cells. n = 4. Error bars in all panels represent mean ± SD (except error bars for spleen weight depict min to max) of biological replicates (individual mice). One-way-ANOVA Tukey’s multiple comparisons test (a–d, g) and Student’s two-tailed, unpaired t test (i, j except for Noxa two-tailed Mann-Whitney test was employed due to non-normal data distribution). Source data and exact p-values (< 0.0001) are provided as a Source Data file.

