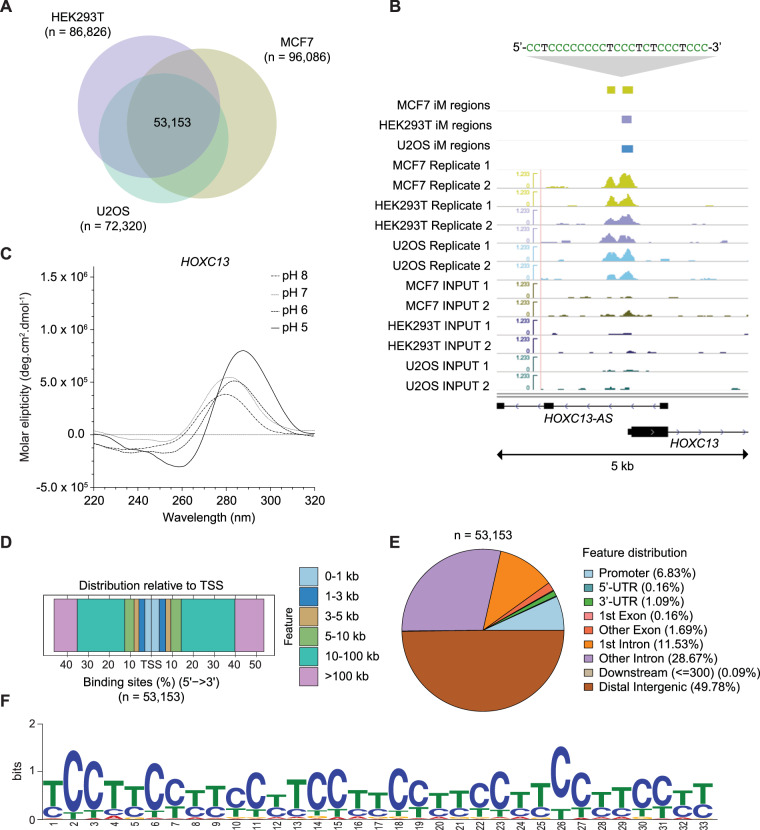
Figure 2. iM structures are detectable and broadly distributed across human genomic DNA.
(A) Total intersected iM regions observed after immunoprecipitation of protein-depleted purified DNA from three different human cell lines (53,153). Each cell line experiment was conducted twice using biological replicates. Coloured circles represent the regions intersected between cell line replicates (HEK293T; n = 86,826) (MCF7; n = 96,086) (U2OS; n = 72,320), (B) Genomic view highlighting an iM structure upstream of the HOXC13 oncogene and downstream the transcription initiation site of HOXC13-AS. iM regions from each cell line replicate are shown (green tracks: MCF7, purple tracks: HEK293T, blue tracks: U2OS, lower tracks: control input profiles). (C) Validation of identified iM upstream of HOXC13 by and circular dichroism spectroscopy under variable pH conditions (pH 5–8) and a temperature of 25 °C. (D) Distribution of iM structures across human genomic DNA. Percentage of genomic features. (E) Distribution relative to transcription starting sites. Represented regions (E, F) are the intersection across all three cell line experiments, n = 53,153. (F) Most frequently identified sequence motif observed in MCF7 DNA (MEME suite (Bailey et al, 2009)). NMR: Nuclear Magnetic Resonance, PDB: Protein Data Bank, MEME: Multiple Expectation maximisations for Motif Elicitation. All data shown from immunoprecipitated iMs at 4 °C and pH 7.4.

