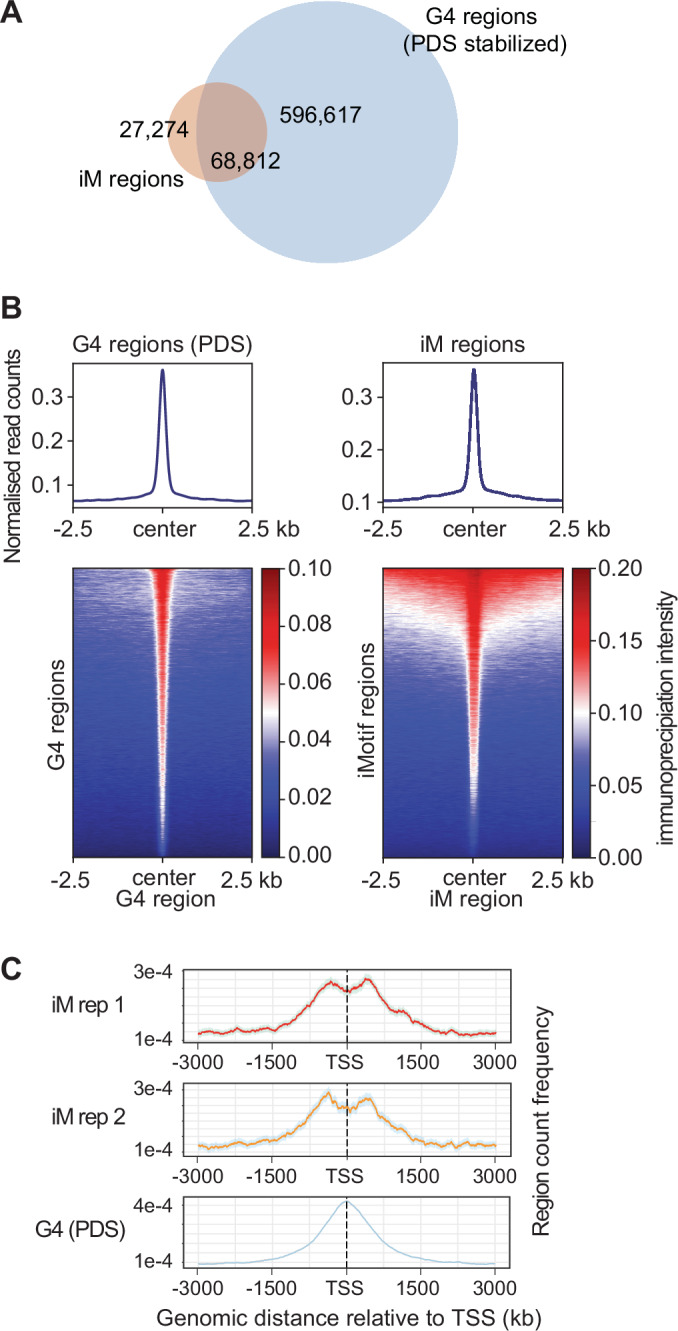
Figure 3. Comparison of iM and G4 annotations.

(A) Overlap of iM regions observed in protein-depleted DNA purified from MCF7 replicates and G4 regions previously reported (PDS stabilised) (Chambers et al, 2015). (B) Tag density histograms and heatmaps representing the occupancy of reads after iMab immunoprecipitation. Representative replicate from MCF7 purified DNA in proximity to published G4 regions stabilised by PDS (Chambers et al, 2015) (left panel) and occupancy of G4 reads in proximity to iM regions (right panel). Datasets are centred with 2.5 Kbp flanks. (C) Count frequency and distance (bp) of iMs and previously reported (PDS stabilised) G4s regions relative to TSS. MCF7 data shown from immunoprecipitated iMs at 4 °C and pH 7.4. PDS pyridostatin.
