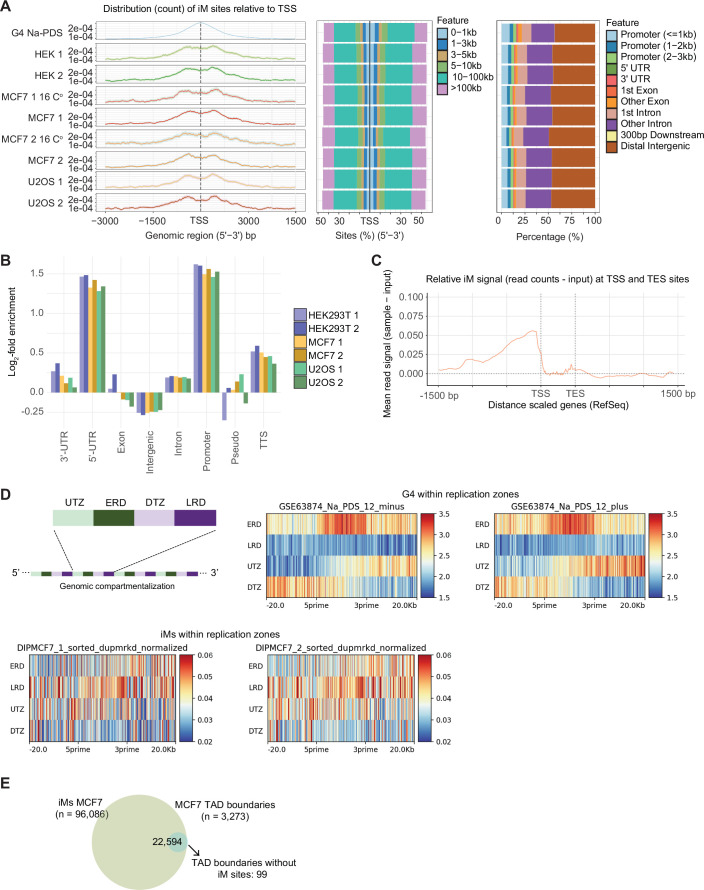
Figure EV3. Distribution and sequences of iM regions in common genomic features, DNA replication zones and TAD boundaries.
(A) Distribution of genomic DNA iM structures across the human genome features. Left panels show the distribution of iM pulldown relative to all TSS regions (Refseq). Centre panels show the percentage of occupancy of iM sites relative to TSS distance. Right panels represent the percentage in relationship with the common gene body features. (B) log2 fold enrichment of iM regions distributed across most common genomic annotations. (C) Relative immunoprecipitated DNA mean signal normalised (sample-input) in relationship to RefSeq gene coordinates. (D) Genomic partition of replication zones (analyses based on repetition of up transition zones (UTZ), early replication zones (ERD), down transition zones (DTZ) and late replication domains (LRD); Tag count heatmaps of G4 (Chambers et al, 2015) (upper panels) and iMs (lower panels; two biological replicates shown). (E) Overlap of iM regions found in DNA purified from MCF7 replicates and previously reported MCF7 TAD boundaries (GSE66733).

