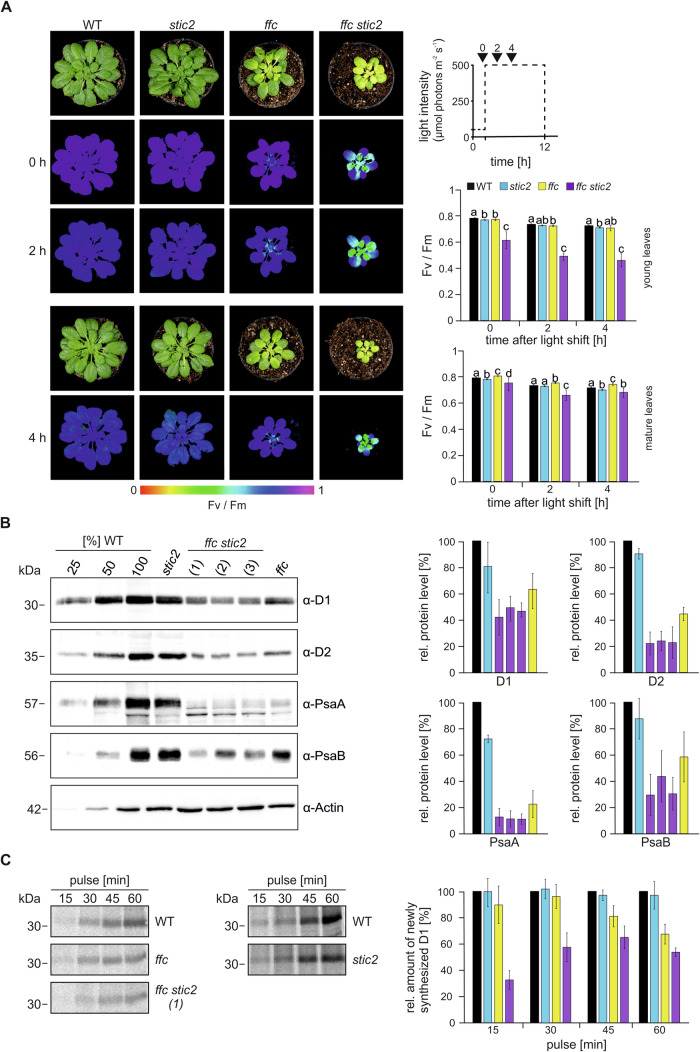
Figure 3. The combined loss of STIC2 and cpSRP54 causes high light sensitivity and low accumulation of D1.
(A) Left: 9-week-old plants of wild type (WT), stic2-3 (stic2), ffc1-2 (ffc) and ffc1-2 stic2-3 (ffc stic2) grown at 50 µmol photons m−2 s−1 with a 12 h photoperiod were shifted to high light (500 µmol photons m−2 s−1). The maximum quantum yield of PSII (Fv/Fm) was determined before the shift (0 h) and 2 and 4 h after the shift. Signal intensities for Fv/Fm are indicated by the false color scale at the bottom of the figure. Right: Overview of experimental setup indicating the time points for Fv/Fm measurements (0, 2, and 4 h) relative to the photoperiod and the light intensity (dotted line) (top). The maximum quantum yield of PSII (Fv/Fm) from young (middle) and mature (bottom) leaves of plants shown in the left panel. Averages and standard deviation are shown (n = 4–10). Statistically significant differences of the means (p < 0.05) between genotypes for the individual time point indicated by letters were determined by the Games-Howell multiple comparison test. (B) Total protein extracts from 5-week-old wild type (WT), stic2-3, ffc1-2 and three lines of ffc1-2 stic2-3 ((1), (2), (3)) were separated by SDS-PAGE and blotted for immunodetection with the indicated antibodies. The Actin level was monitored as loading control. The WT samples corresponded to 25, 50, and 100% of total protein. The protein levels were quantified using ImageJ in relation to WT (100%). Means and SDs were calculated from at least three independent biological replicates. (C) Leaf discs of wild type (WT) and the indicated A. thaliana mutants were incubated in a [35S]-methionine containing solution in presence of cycloheximide at ambient light. After an incubation for 15, 30, 45, and 60 min thylakoid membrane proteins were extracted and used for SDS-PAGE and phosphor imaging. Signals were quantified (ImageJ) in relation to WT with WT corresponding to 100% for each time point. Means and SDs were calculated from at least three independent biological replicates. Source data are available online for this figure.

